

By: Ron Pernick

Quarterly overview of stock index performance and the top trends impacting the state of clean tech.
2020 proved to be a banner year for thematic clean-energy and broader clean-tech indexes. A combination of factors is at play, including improving economics (solar and wind power are now among the most cost competitive sources of new electricity capacity additions in the U.S. and abroad); record-breaking growth of multiple clean-energy sectors during the global COVID-19 pandemic (shining a light on the resilience of wind and solar markets, in particular); and the expansion of green stimulus plans across Europe, Asia, and the U.S. (with the election win of Joe Biden being the proverbial feather in the cap).
Against this backdrop, during Q4, Nasdaq-Clean Edge indexes, on a total return basis, were all up, with CELS (U.S. clean energy) increasing 58.95%, GWE (global wind) increasing 33.62%, QGRD (global smart grid & grid infrastructure) up 28.83%, and HHO (U.S. water) up 19.80%. During the same time frame, the S&P 500 index increased 12.15% and the IXE (Energy Select) was up 28.30%.
Q4 2020 Index Performance (Total Return)
As of December 31, 2020 | CELS (U.S. Clean Energy) | GWE (Global Wind) | HHO (U.S. Water) | QGRD (Global Grid) | S&P 500 | IXE (Energy Select) |
|---|---|---|---|---|---|---|
Q4 (Total Return) | 58.95% | 33.62% | 19.80% | 28.83% | 12.15% | 28.30% |
2020 (Total Return) | 184.83% | 62.47% | 22.17% | 49.84% | 18.40% | -32.84% |
For the full year 2020, on a total return basis, Nasdaq-Clean Edge indexes all outperformed the S&P 500. CELS was up 184.83%, GWE increased 62.74%, QGRD was up 49.84%, and HHO increased 22.17%, compared to the S&P 500’s 18.40% increase. During the same time period IXE declined 32.84%.
2020 Full Year Index Performance (Total Return)
First Trust ETFs tracking Nasdaq Clean Edge indexes equaled more than $3 billion in assets under management as of January 2021.
DATA DIVE: CLEAN ENERGY VS. BIG OIL
One of the big shifts mentioned above is the dramatically changing economic landscape as clean-energy sources such as solar and wind expand due to increasingly competitive pricing and rising demand for zero-carbon forms of energy. While market caps are not directly correlated to such economic and societal shifts, they do provide a layer of insight into which sectors the market is favoring. For example, in the bubble chart below, we compare the market caps of Clean Energy Leaders such as Tesla, NextEra, Ørsted, Vestas, and Iberdrola against traditional Oil Majors such as Exxon Mobil, Shell, Chevron, Total and BP over a two-year period.
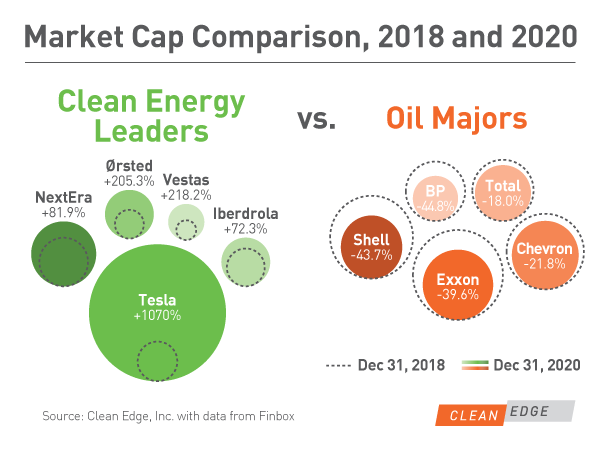
During the two-year period examined, all Clean Energy Leaders experienced significant growth in their market capitalizations. Tesla, which expanded from $57.2 billion in 2018 to $668.9 billion in 2020, has surpassed all five Oil Majors in total market cap. NextEra Energy’s 2020 market cap of $151.1 billion, up from $82.1 billion in 2018, exceeds that of Shell, Total, and BP. Iberdrola grew from $50.8 billion in 2018 to $87.6 billion in 2020. Ørsted and Vestas, both based in Denmark, more than tripled their market cap in the two-year period. Ørsted began at $28.1 billion in 2018 and grew to $85.7 billion in 2020, while Vestas' market cap was $14.9 billion in 2018 and ended 2020 at $47.5 billion.
Oil Majors all experienced declines during this same period. BP's market cap shrunk by the largest percentage, falling to $70.3 billion from $127.4 billion in 2018. Exxon Mobil, the largest of the Oil Majors, dropped from $288.7 billion in 2018 to a market cap of $174.3 billion at the end of 2020. Shell fell to $136.3 billion from $242.3 billion. Chevron and Total each lost about 20% of their market cap, falling from $207.9 to $162.6 billion and $138 to $113.2 billion, respectively.
WINNERS AND LOSERS (INDEX CONSTITUENTS RANKED BY PRICE RETURN)
Below is a list of the top 10 best and worst constituent performers across all Clean Edge Nasdaq indexes (CELS, QGRD, HHO, and GWE) during both the entire year and in Q4. During 2020, two companies, Blink Charging Co, and Nio Inc, both increased more than 1,000% and five of the top 10 performers were comprised of EV and EV charging companies (Blink, Nio, Tesla, Workhorse, and BYD – although Workhorse was also the biggest loser in Q4, giving back 22% of its earlier gains).
Best and Worst Constituents (Full Year 2020)
Winners | Losers | ||
|---|---|---|---|
Blink Charging Co. | 2198.39% | Companhia de Saneamento Basico do Estado de Sao Paulo-SABESP (ADR) | -42.92% |
NIO Inc. | 1112.44% | AGL Energy Ltd. | -36.21% |
Plug Power Inc. | 973.10% | Flowserve Corporation | -25.96% |
Tesla, Inc. | 743.44% | Landis+Gyr Group AG | -24.64% |
Enphase Energy, Inc. | 571.53% | Belden Inc. | -23.82% |
Workhorse Group Inc. | 550.66% | Mitsubishi Heavy Industries Ltd. | -21.84% |
Daqo New Energy Corporation | 460.16% | Toshiba Corporation | -17.76% |
BYD Company Ltd. | 425.58% | Aegion Corporation | -15.11% |
Unison Co., Ltd. | 418.85% | THE Gorman-Rupp Company | -13.47% |
Sunrun Inc. | 402.39% | Acuity Brands, Inc. | -12.25% |
Best and Worst Constituents (Q4 2020)
Winners | Losers | ||
|---|---|---|---|
Fuelcell Energy, Inc. | 421.96% | Workhorse Group Inc. | -21.76% |
Blink Charging Co. | 314.65% | Brookfield Renewable Partners L.P. | -17.89% |
Plug Power Inc. | 152.87% | Sunrun Inc. | -9.98% |
Xinjiang Goldwind Science & Technology Co., Ltd. | 130.39% | NEC Corporation | -7.84% |
NIO Inc. | 129.69% | AGL Energy Ltd. | -5.75% |
Enphase Energy, Inc. | 112.46% | NVIDIA Corporation | -3.51% |
Daqo New Energy Corporation | 112.07% | Osaki Electric Co. Ltd. | -3.21% |
Livent Corporation | 110.03% | Alliant Energy Corporation | -0.23% |
Sunpower Corporation | 104.96% | E.ON SE | -0.02% |
CS Wind Corporation | 91.81% | Unison Co., Ltd. | 1.98% |
QUARTERLY INSIGHT: RISE OF THE SPAC
Each quarter, we like to shine a light on a major trend. In this quarter we take a closer look at the rise of special purpose acquisition corporations (SPACs), which emerged as a fast-growing financing path for clean-tech companies (and many other sectors) in 2020. SPACs, also known as blank-check companies, offer firms an alternative to traditional IPOs (they’re already listed on a stock exchange and take companies public via acquisition or merger). As of late December, SPACs had raised nearly $80 billion in capital in 237 deals in 2020, a more than fourfold increase from 2019 and outpacing the $67 billion raised by traditional IPOs, according to Zacks Investment Research. About two dozen of the 2020 SPAC deals were in the clean energy and transportation sector.
Some notable clean-tech players that went public via SPAC acquisition in 2020 include EV makers Nikola (NASDAQ: NKLA) and Fisker (NYSE: FSR), and battery storage company QuantumScape (NYSE: QS). SPAC deals announced in 2020 and expected to close later this year include Engie’s Netherlands-based EVBox unit, operator of Europe’s largest EV charging network, U.S.-based charging network ChargePoint, and storage pioneer Stem. In addition, well-known executives like former NRG CEO David Crane and noted SunPower and Enphase investor T.J. Rodgers launched SPACs that are seeking clean-tech and climate-tech acquisitions: Climate Real Impact Solutions (NYSE: CLII.U) and Rodgers Silicon Valley Acquisition Corp. (NASDAQ: RSVAU), respectively. One concern surrounding this plethora of SPACs is that the acquired companies don’t have to go through the more rigorous process of a traditional IPO and the resulting high level of due diligence.
Disclaimer:
The information contained above is provided for informational and educational purposes only. Clean Edge is not an investment adviser, and none of the information, including any Nasdaq Clean Edge index, should be construed as investment advice or relied on as the basis for making any kind of investment decision. Neither Clean Edge nor any of its affiliates makes any recommendation whatsoever to buy or sell any securities, fund, or financial product or any representation about the financial condition of any company, fund, or financial product. Information regarding any Clean Edge index is not a guarantee of future performance. Actual results may differ materially from those expressed or implied. Past performance is not indicative of future results and should never be relied upon for making any kind of investment decisions. Investors should undertake their own due diligence and carefully evaluate companies before investing. ADVICE FROM A SECURITIES PROFESSIONAL IS STRONGLY ADVISED.