

By: Ron Pernick

Quarterly overview of stock index performance and the top trends impacting the state of clean tech.
In the just-released Enabling the Energy Transition 2023 and Water Infrastructure and Resiliency 2023 publications, Nasdaq and Clean Edge examine the major trends, opportunities, and challenges impacting the energy transition and water markets. Based on deployment growth, historical cost declines, environmental pressures, and a host of other factors, this is perhaps the most dynamic period since we began analyzing and researching the thematic clean-tech sector more than two decades ago. At the same time, higher interest rates (making the deployment of capital-intensive clean technologies more challenging in some sectors) and historically high fossil fuel prices (bolstering the oil and gas sector) have put pressure on some of the publicly traded companies that we track.
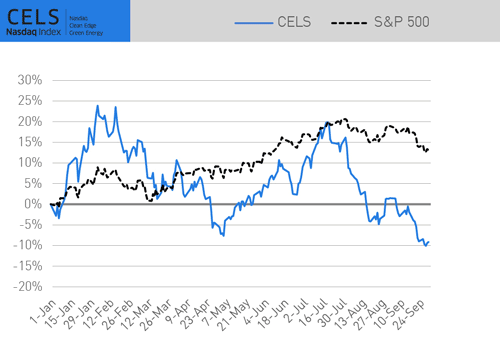
Against this backdrop, year to date (YTD) through the end of September, Nasdaq Clean Edge indexes exhibited somewhat divergent performance between our innovation- and infrastructure-focused thematics. The Nasdaq OMX Clean Edge Smart Grid Infrastructure™ Index (QGRD™) was the top performer among Nasdaq Clean Edge indexes, up 9.42%, followed by the water and wastewater infrastructure focused ISE Clean Edge Water™ Index (HHO™), which was up 5.20%. The Nasdaq Clean Edge International Green Energy™ Index (CELSI™) increased 0.31%, while the Nasdaq Clean Edge Green Energy™ Index (CELS™) was down 9.12% and the ISE Clean Edge Global Wind Energy™ Index (GWE™) declined 14.15%. The S&P 500 increased 13.07% over the same period while the IXE (Energy Select) index was up 6.15%. All results are on a total return basis.
YTD Index Performance (Total Return Through September 29, 2023
As of Sept. 29, 2023 (Total Return) | CELS (U.S. Clean Energy) | GWE (Global Wind) | HHO (U.S. Water) | QGRD (Global Grid) | CELSI (Ex-U.S. Clean Energy) | GGINC (Global Green Income) | S&P 500 | IXE (Energy Select) |
|---|---|---|---|---|---|---|---|---|
Q3 | -16.63% | -15.77% | -6.30% | -10.02% | -12.40% | -10.16% | -3.27% | 12.27% |
YTD | -9.12% | -14.15% | 5.20% | 9.42% | 0.31% | N/A | 13.07% | 6.15% |
12-Month | -24.45% | -1.70% | 16.85% | 26.72% | 15.21% | N/A | 21.62% | 30.41% |
During Q3, all Nasdaq Clean Edge indexes declined. HHO and QGRD fared the best, down 6.30% and 10.02% respectively. The Nasdaq Clean Edge Global Green Income™ Index (GGINC™) declined 10.16%, followed by GWE and CELS, down 15.77% and 16.63% respectively. The S&P 500 declined 3.27%, while IXE was the only index in the green, up 12.27%.
Q3 2023 Index Performance (Total Return)

Over the past 12 months, the top Nasdaq Clean Edge index performer (beating out the S&P 500) was infrastructure-related QGRD, increasing 26.72% followed by HHO and CELSI, up 16.85% and 15.21% respectively. During the same time frame, GWE was down slightly by 1.70% and CELS declined 24.45%. This compares to the S&P 500’s 21.62% increase and IXE’s 30.41% increase over the 12-month period.
12-Month Index Performance (Total Return Through September 29, 2023)

Financial products tracking Nasdaq Clean Edge indexes equaled more than $4 billion in assets under management as of October 11, 2023.
DATA DIVE: CELS, QGRD, HHO & GWE CONSTITUENTS REFLECT SECTORAL DIVERSITY
As highlighted above, Nasdaq Clean Edge indexes cover a wide range of clean-tech activities spanning clean energy, transportation, water, and the grid. Among the top 10 constituents in each of the indexes highlighted below, only a single company appears in more than one index (Enphase Energy is in both QGRD and CELS). By tracking these four diverse sectors, the indexes cover a broad spectrum of players in clean-tech innovation and deployment.

WINNERS AND LOSERS (INDEX CONSTITUENTS RANKED BY PRICE RETURN)
Below is a list of the top 10 best and worst constituent performers across all six Nasdaq Clean Edge indexes during Q3 2023.
Best and Worst Constituents (Q3 2023)
Winners | Losers | ||
|---|---|---|---|
Ultralife Corp. | 101.65% | TPI Composites, Inc. | -74.45% |
Fortune Electric Co., Ltd. | 77.26% | Abalance Corp. | -69.51% |
Galata Wind Enerji A.S. | 73.75% | FTC Solar, Inc. | -60.25% |
Rivian Automotive, Inc. | 45.74% | Maxeon Solar Technologies, Ltd. | -58.84% |
Hyosung Heavy Industries Corp. | 44.47% | SolarEdge Technologies, Inc. | -51.86% |
Iljin Electric Co., Ltd | 29.83% | Eos Energy Enterprises, Inc. | -50.46% |
Century Iron & Steel Industrial Co., Ltd. | 28.40% | NextEra Energy Partners L.P. | -49.35% |
ESS Tech, Inc. | 27.89% | Blink Charging Co. | -48.91% |
LSI Industries, Inc. | 26.43% | SMA Solar Technology AG | -46.71% |
West Holdings Corp. | 24.86% | ChargePoint Holdings, Inc. | -43.46% |
QUARTERLY INSIGHT: DEFINING A SECTOR
It’s been 24 years since the concept behind Clean Edge and the goal of fostering the then-nascent clean-tech ecosystem was born (on a plane ride returning from an environmental conference in Geneva with an unplanned detour to Paris); 23 years since we launched the company with co-founder Joel Makower; and 17 years since we partnered with Nasdaq on our first index collaboration (CELS). During the entire history of Clean Edge, from co-authoring two books with my colleague Clint Wilder, publishing more than 60 reports, consulting to dozens of corporate, governmental, and NGO clients, and providing the research behind a total of now six clean-tech indexes with licenses spanning North America, Europe, and Asia, our ability to define and track the industry has been tantamount to our mission and success.
CELS & QGRD vs. Energy Transition Comps (Historical Performance)

And definitions matter. Our thematic research enables us to capture the broad clean-tech thesis, with CELS covering revenue-producing, pure play-listed companies focused on the clean-energy theme, while QGRD focuses on the underlying electric grid infrastructure that is the backbone for a smarter, cleaner, more resilient 21st century grid (including both the major industrial companies and grid pure plays at the forefront of this trend). As shown above, QGRD’s focus has enabled it to be a top performer YTD and during the 1 Year and 3 Year annualized periods tracked against three major clean-energy and energy-transition comps. For the 5 Year annualized period, CELS came out on top. The worst performer YTD among the five indexes compared was the WilderHill Clean Energy Index, declining 26.77%. The S&P Global Clean Energy Index was the laggard during the other periods, declining 34.25% and 19.33% during the 1 Year and 3 Year annualized periods and increasing 5.35% during the 5 Year annualized period.
Disclaimer:
The information contained above is provided for informational and educational purposes only. Clean Edge is not an investment adviser, and none of the information, including any Nasdaq Clean Edge index, should be construed as investment advice or relied on as the basis for making any kind of investment decision. Neither Clean Edge, nor Nasdaq, Inc., or any of its affiliates make any recommendation whatsoever to buy or sell any securities, fund, or financial product or any representation about the financial condition of any company, fund, or financial product. Information regarding any Clean Edge index is not a guarantee of future performance. Actual results may differ materially from those expressed or implied. Past performance is not indicative of future results and should never be relied upon for making any kind of investment decisions. Investors should undertake their own due diligence and carefully evaluate companies before investing. ADVICE FROM A SECURITIES PROFESSIONAL IS STRONGLY ADVISED.