

By: Ron Pernick

Quarterly overview of stock index performance and the top trends impacting the state of clean tech.
Clean energy is entering a new cycle in its maturation journey. For renewable energy analysts and market participants, the promise of technology-driven renewable energy sources over fossil fuels has been clear. Extractive energy sources, by their very nature as commodities, exhibit price volatility when pitted against maturing tech-centric clean energy sectors – with their inherent cost-reducing learning curves. As we’ve said before, however, the transition to clean energy will be bumpy. Fossil fuels continue to play an outsized role in the global economy and most people’s daily lives, and we need to navigate the transition accordingly. In our quarterly insight below, we highlight some of the key technological innovations at the forefront of the shift toward solar, wind, energy storage, and vehicle and building electrification.
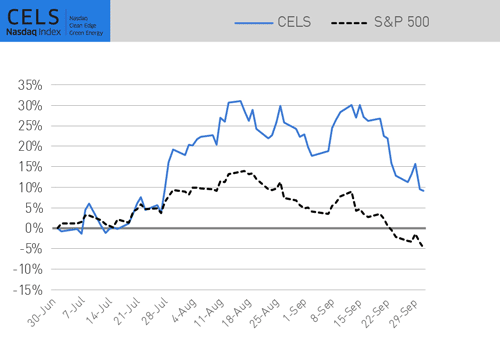
Against this backdrop, during Q3, CELS (U.S. clean energy) was up 9.10%, outperforming both the S&P 500 which declined 4.88% and IXE (Energy Select) which was up 1.65%. Over the same time frame, HHO (U.S. water) decreased 0.17%, QGRD (global smart grid & grid infrastructure) declined 2.05%, and GWE (global wind) was down 10.84%.
Q3 2022 Index Performance (Total Return)
As of September 30, 2022 (Total Return) | CELS (U.S. Clean Energy) | GWE (Global Wind) | HHO (U.S. Water) | QGRD (Global Grid) | S&P 500 | IXE (Energy Select) |
|---|---|---|---|---|---|---|
Q2 | 9.10% | -10.84% | -0.17% | -2.05% | -4.88% | 1.65% |
YTD | -15.97% | -23.84% | -23.63% | -25.16% | -23.87% | 33.94% |
12-Month | -8.61% | -25.85% | -14.32% | -16.86% | -15.47% | 44.49% |
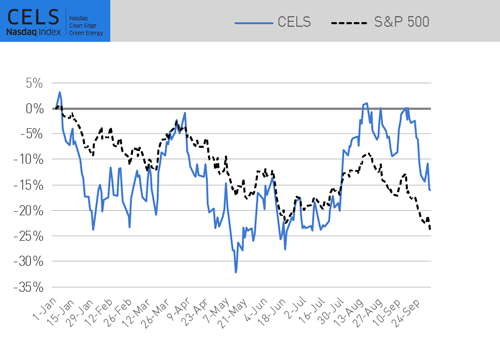
Year to date (YTD), CELS dropped 15.97% compared to the S&P 500’s 23.87% decline. HHO, GWE, and QGRD all declined, down 23.63%, 23.84% and 25.16% respectively. YTD IXE continued to have a strong showing up 33.94%. All results are on a total return basis.
YTD Index Performance (Total Return Through September 30, 2022)
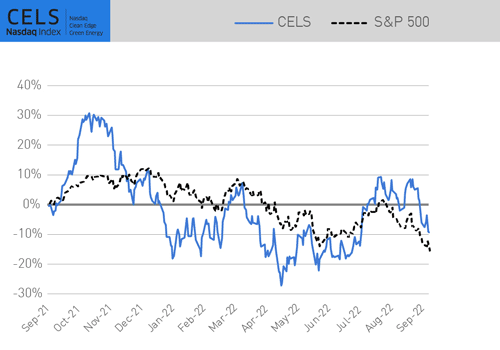
Over the past 12 months (total return basis through the end of June), CELS declined 8.61%, followed by HHO, QGRD, and GWE down 14.32%, 16.86% and 25.85% respectively, compared to the S&P 500’s 15.47% decrease and IXE’s 44.49% increase.
12-Month Index Performance (Total Return Through September 30, 2022).
Financial products tracking Nasdaq Clean Edge indexes equaled more than $4 billion in assets under management as of September 2022.
DATA DIVE: EV DEPLOYMENT AND MARKET SHARE ON THE RISE
Electric vehicles (EVs) have begun to penetrate global markets, with 16.2 million electric passenger cars on roads as of 2021 (up from just 190,000 in 2012). China leads the world in total deployment at 6.2 million battery electric vehicles (BEVs) and 1.6 million plug-in hybrid electric vehicles (PHEVs). The number of EVs in China expanded by an astounding 46,000% since 2012, with market efficiencies driven by heavy investment into domestic EV production. Electric passenger car sales doubled between 2020 and 2021, reaching 16% of total vehicle sales. Second-place U.S. has deployed just over 2 million EVs, with nearly 27x growth since 2012, comprising 4.6% of all vehicles sold in 2021.
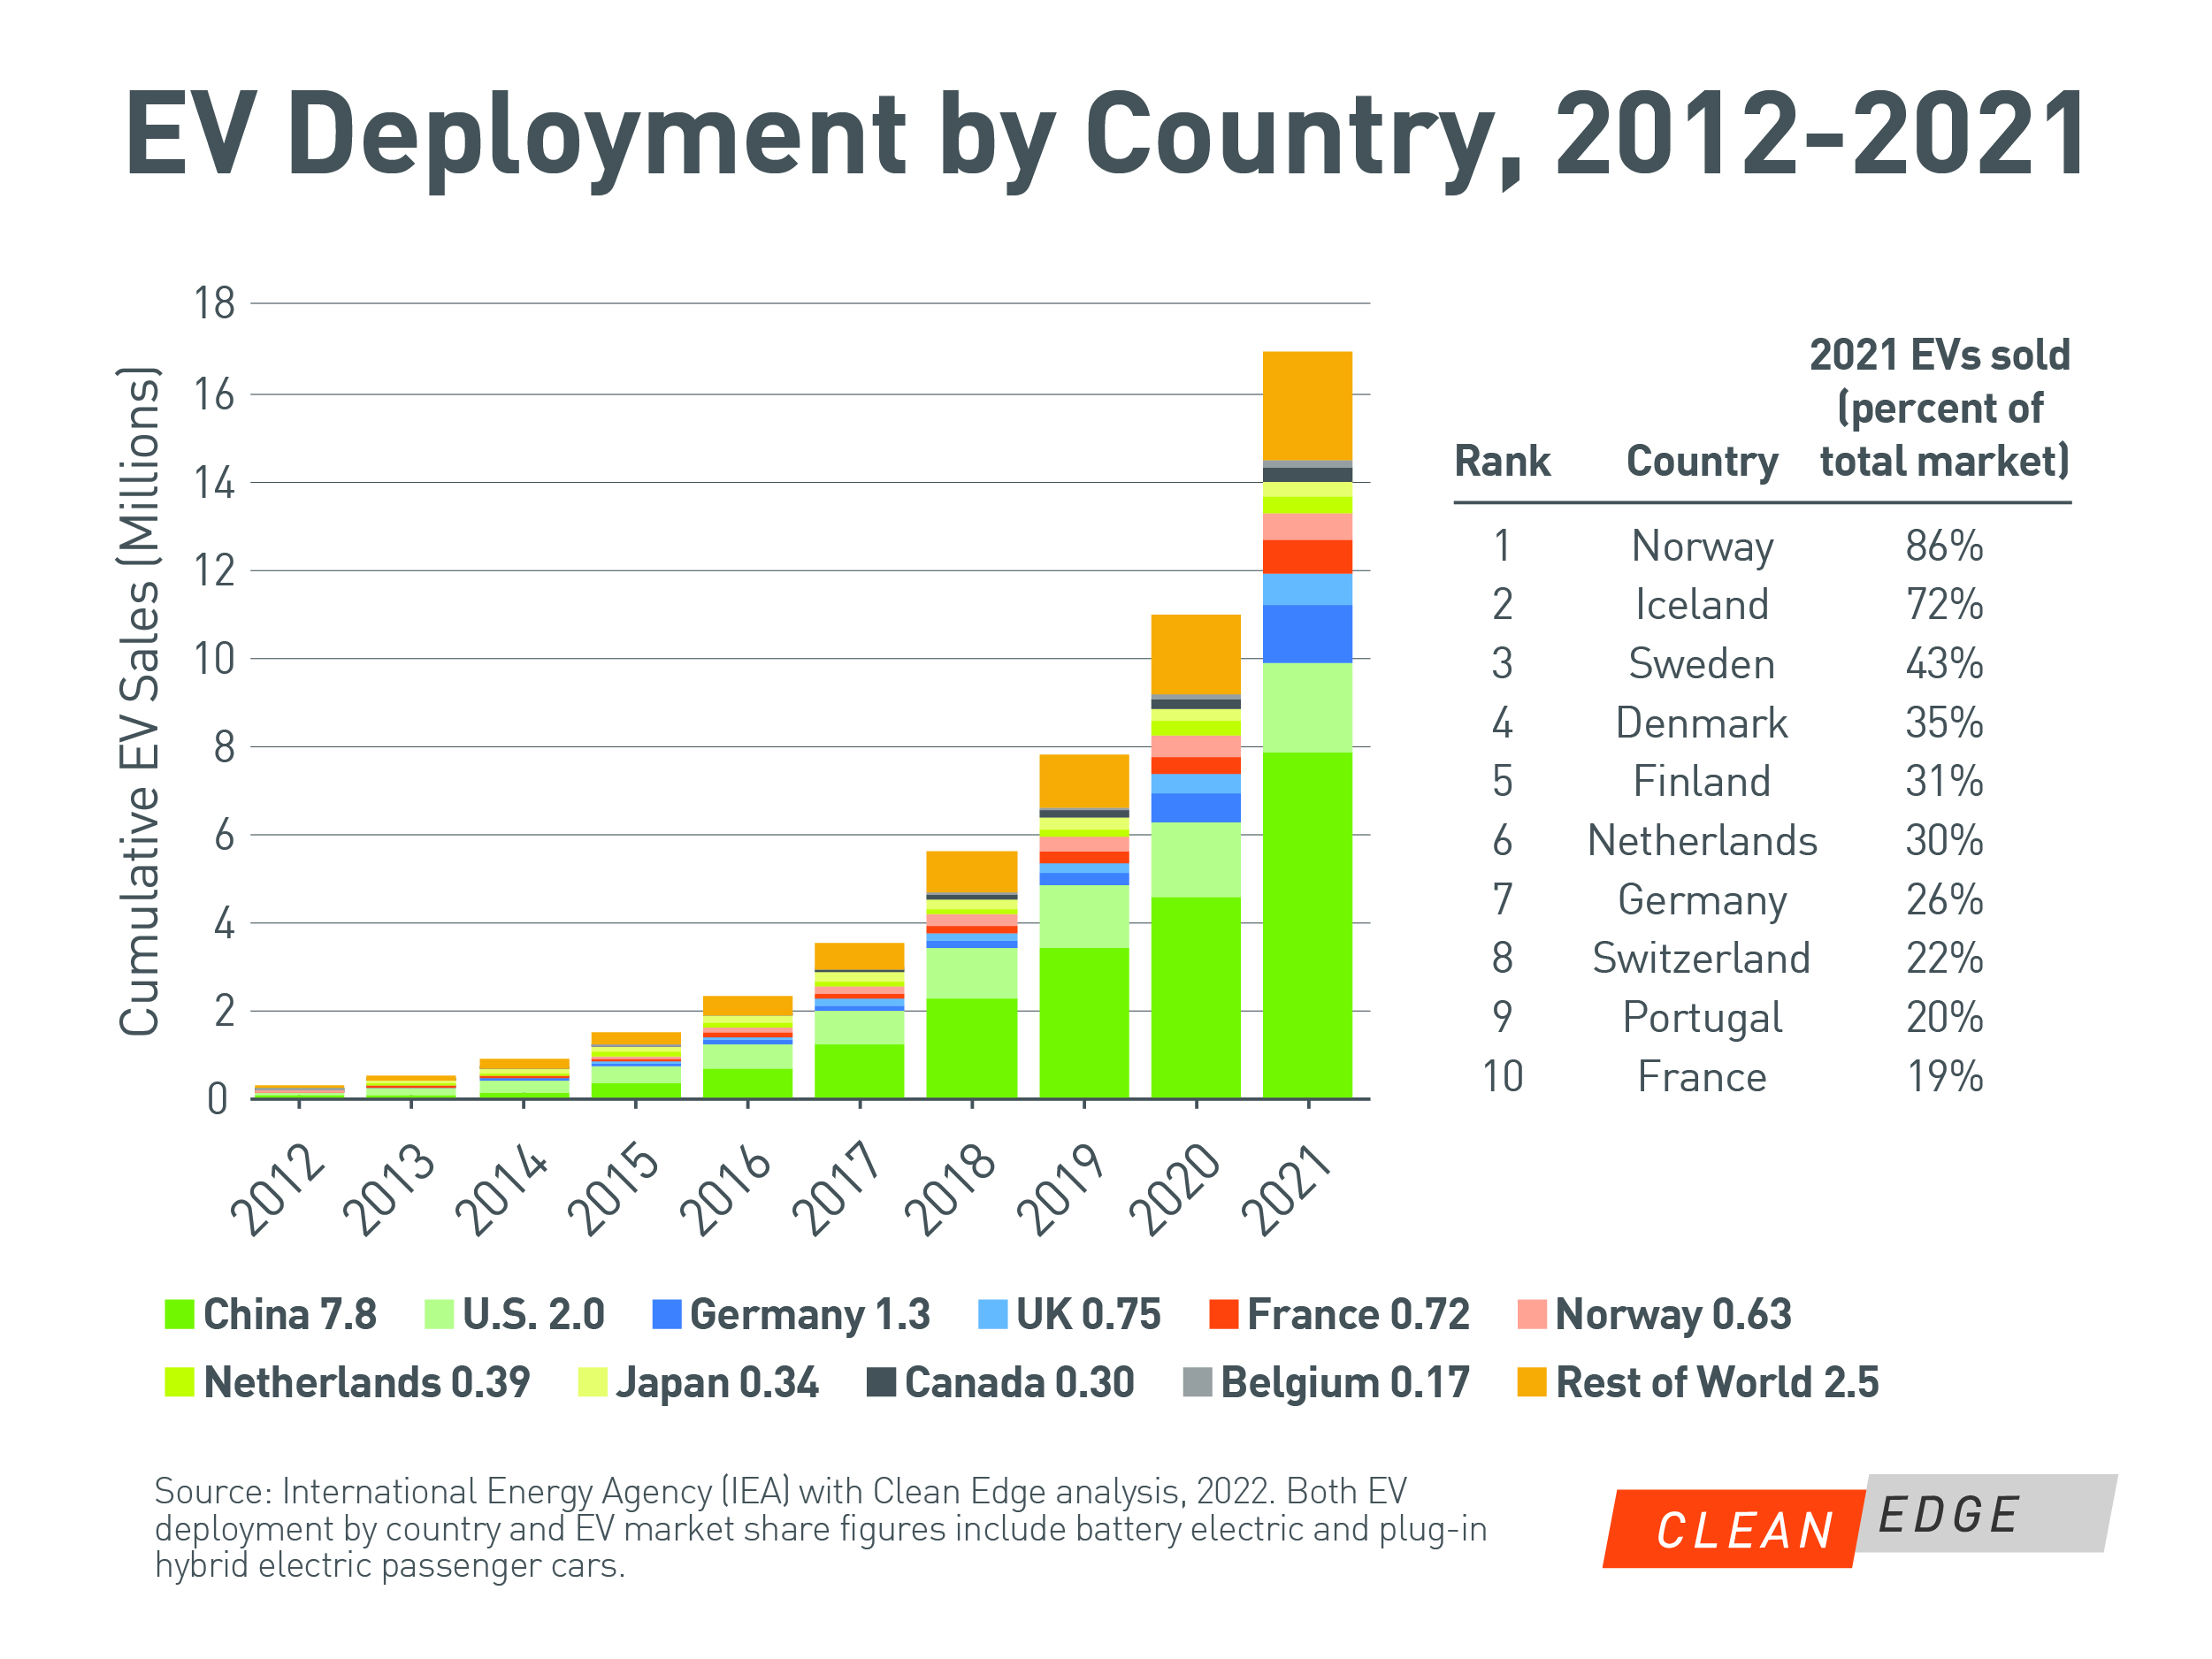
While China and the U.S. surpass all other countries in total sales, Europe leads in EV market penetration. Ten European countries topped the world ranking for EVs sold as a percentage of total vehicle sales in 2021. These countries have strong incentives in place for EV owners, including reduced taxes, tolls, and parking fees. Norway and Iceland top the chart, with EVs making up 86% and 72% of passenger car sales, respectively. EV passenger car sales in China are projected to reach 25% this year, likely edging out France, Portugal, and Switzerland.
WINNERS AND LOSERS (INDEX CONSTITUENTS RANKED BY PRICE RETURN)
Below is a list of the top 10 best and worst constituent performers across Nasdaq Clean Edge indexes (CELS, QGRD, HHO, and GWE) during Q3 2022.
Best and Worst Constituents (Q2 2022)
Winners | Losers | ||
|---|---|---|---|
First Solar, Inc. | 94.14% | Azure Power Global Ltd. | -51.40% |
Stem, Inc. | 86.31% | Gogoro Inc. | -50.72% |
Maxeon Solar Technologies, Ltd. | 78.86% | Tritium DCFC Ltd. | -47.62% |
Altus Power, Inc. | 74.48% | Willdan Group, Inc. | -46.30% |
Montauk Renewables, Inc. | 73.53% | BYD Co. Ltd. | -38.11% |
Wolfspeed, Inc. | 62.90% | Xinjiang Goldwind | -37.97% |
Fluence Energy, Inc. | 53.90% | CS Bearing Co., Ltd. | -37.69% |
Array Technologies, Inc. | 50.59% | China Longyuan Power Group | -35.05% |
Ameresco, Inc. | 45.92% | Unison Co., Ltd. | -34.99% |
SunPower Corporation | 45.73% | Lion Electric Co. | -32.07% |
QUARTERLY INSIGHT: INNOVATION SCALES
As noted above, clean energy is entering a new cycle in its development journey and presents a once-in-a-generation innovation opportunity to rebuild economies and ensure greater resiliency in the face of climate disruption and fossil fuel volatility. The promise and imperative of tech-driven renewable energy sources over extractive fossil fuels have been obvious to many renewable energy analysts and market players: polluting extractive industries are no match economically for tech-centric clean energy sectors as the latter mature. Indeed, the energy playing field is shifting dramatically as solar, wind, and grid storage decline in cost while fossil fuels negatively impact climate and the environment – and are wielded as geopolitical weapons.
We’ve written extensively about the impact of recent government policies supporting the energy transition across North America, Europe, and Asia, with the passing of the U.S. Inflation Reduction Act being the most notable. But many of the key drivers are not policy or regulatory in nature, but instead are driven by tech innovation. Below are two key tech developments accelerating the shift to a clean-energy economy.
Clean Energy Learning Curves
In recent decades, the solar PV industry has exhibited a remarkably consistent price learning curve (also called an experience curve). For every doubling of solar PV modules manufactured, the cost of solar PV modules has declined approximately 20%. Since 2010, utility-scale solar and onshore wind have seen the greatest decline in costs compared with other energy sectors, with both solar and wind currently coming in at around $40 per MWh or 4 cents per KWh. Onshore wind costs are down more than 60% and the costs of both crystalline PV solar modules and lithium-ion battery packs are down nearly 90% since 2010. Coal and nuclear power costs have both increased during the same period. Solar and wind, as technology-centric energy sources, with no fuel costs, have experienced economies of scale more akin to the semiconductor chip industry than to traditional energy sectors. Recent research out of Oxford University shows that, based on historic price data (up to 140 years) for 50 different energy technologies/systems, pricing of fossil fuel sources coal, oil, and natural gas were relatively unchanged (adjusted for inflation) – while the tech-driven sectors of solar, wind, and battery storage significantly declined in cost.
U.S. Renewables Now Cheaper than Natural Gas
Newly released analysis from Guggenheim Securities revealed some pretty stunning numbers: U.S. utility-scale solar is now about a third cheaper than gas-fired power, and onshore wind is an even more dramatic 44% less expensive. Although solar and wind both need energy storage for an apples-to-apples comparison with natural gas power plants, cost curves continue to align in favor of a clean energy build-out of electricity infrastructure. As we've reported before, solar and wind power are now cheaper than fossil fuels in most regions around the globe. According to IRENA, two thirds of newly installed renewable power in G20 countries had lower costs than the cheapest fossil fuel-fired option in 2021. And the IEA found that 81% of global electricity capacity additions last year came from renewables. Guggenheim analyst Shahriar Pourreza says it well: “Solar and wind now present a deflationary opportunity for electric supply costs [which] supports the case for economic deployment of renewables across the U.S.”
While solar and wind are now among the most cost-effective sources of new electricity capacity additions, we’ll need to see similar cost reductions for EVs, energy storage, electrolyzers, and other electrification technologies over the coming decade. We’ll also need to see cost declines for grid integration of these technologies (connecting an offshore wind farm, for example, to the grid and getting the electricity to nearby and/or distant customers) – and for deployment obstacles to be removed or streamlined. Achieving the energy transition won’t be easy, but over time it promises lower costs, zero to limited emissions, and greatly diminished geopolitical volatility.
Disclaimer:
The information contained above is provided for informational and educational purposes only. Clean Edge is not an investment adviser, and none of the information, including any Nasdaq Clean Edge index, should be construed as investment advice or relied on as the basis for making any kind of investment decision. Neither Clean Edge nor any of its affiliates makes any recommendation whatsoever to buy or sell any securities, fund, or financial product or any representation about the financial condition of any company, fund, or financial product. Information regarding any Clean Edge index is not a guarantee of future performance. Actual results may differ materially from those expressed or implied. Past performance is not indicative of future results and should never be relied upon for making any kind of investment decisions. Investors should undertake their own due diligence and carefully evaluate companies before investing. ADVICE FROM A SECURITIES PROFESSIONAL IS STRONGLY ADVISED.