By: Ron Pernick

Quarterly overview of stock index performance and the top trends impacting the state of clean tech.
Supply disruptions and staffing shortages continued to loom large during the third quarter of 2021. While the economy proved remarkably resilient in the face of an unprecedented global pandemic, a range of commodity shortages (see Quarterly Insight: Price Volatility is Embedded in Fossil Fuels below) have hit Europe particularly hard. In the U.S., political disagreement and gamesmanship continued to leave the country without passage of either the infrastructure bill or Build Back Better plan championed by President Biden, both centerpieces of his economic agenda.
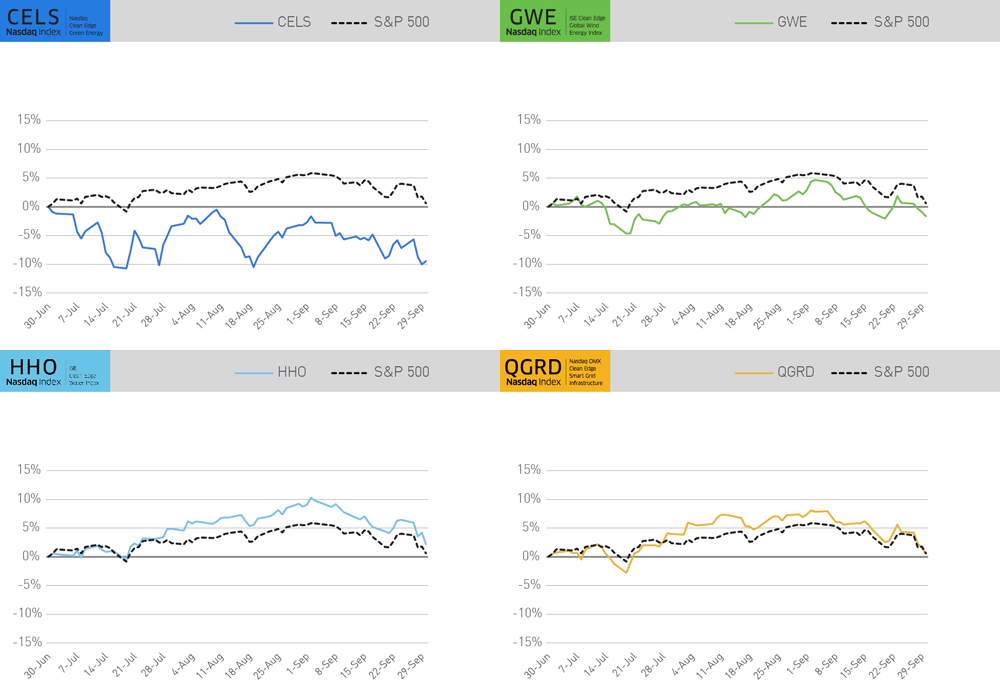
Against this backdrop, indexes in our coverage remained relatively flat during the third quarter. The S&P 500 was up 0.58% while the traditional energy-focused IXE index declined -2.06%. Among the Nasdaq-Clean Edge indexes, those with an emphasis on infrastructure continued to perform best, with HHO (U.S. water) up 2.18% and QGRD (global smart grid and grid infrastructure) increasing 0.47% on a total return basis. CELS (U.S. clean energy) and GWE (global wind), continued to come off their recent highs, down -9.46% and -1.68% respectively during the quarter.
Q3 2021 Index Performance (Total Return)

As of September 30, 2021 (Total Return) | CELS (U.S. Clean Energy) | GWE (Global Wind) | HHO (U.S. Water) | QGRD (Global Grid) | S&P 500 | IXE (Energy Select) |
|---|---|---|---|---|---|---|
Q3 | -9.46% | -1.68% | 2.18% | 0.47% | 0.58% | -2.06% |
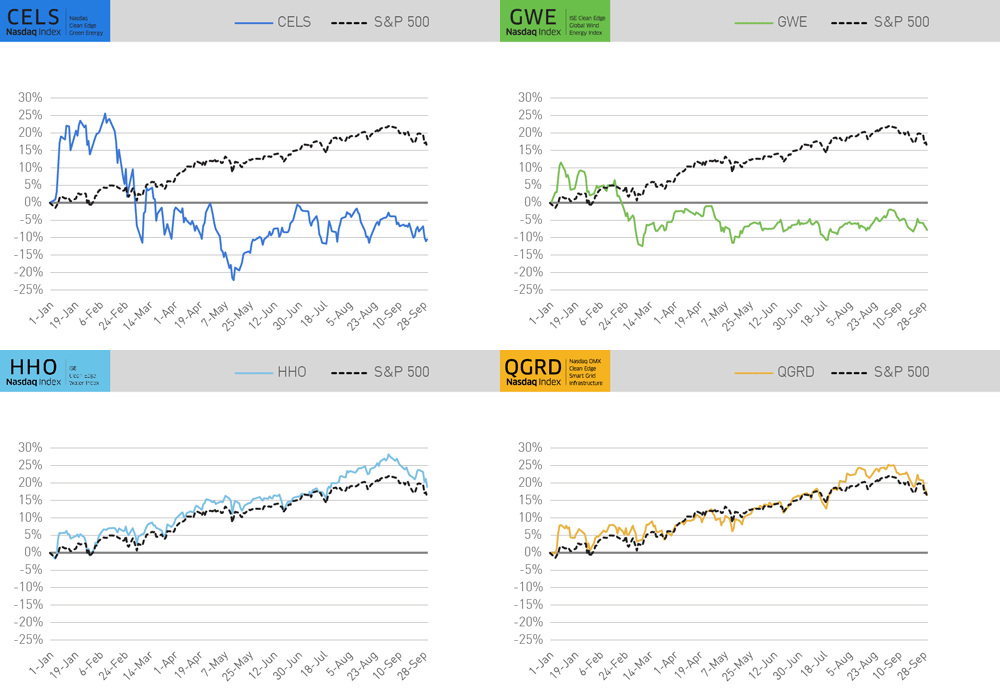
YTD | -10.49% | -7.87% | 18.82% | 16.42% | 15.92% | 42.23% |
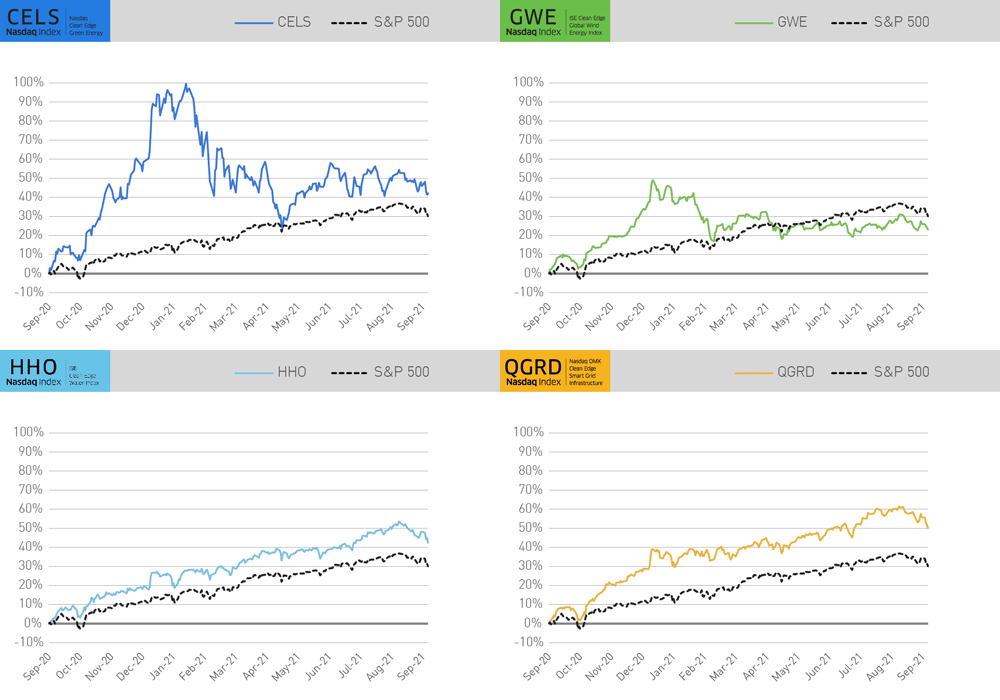
12-Month | 42.28% | 23.10% | 42.35% | 49.98% | 30.01% | 82.48% |
Year to date (YTD), the Nasdaq-Clean Edge indexes centered on the electrical grid and water infrastructure outperformed the S&P 500’s 15.92% result. HHO increased 18.82% and QGRD was up 16.42%. Indexes focused on renewable energy continued to correct from high levels experienced at the end of 2020 and the start of 2021. CELS declined 10.49% and GWE fell 7.87%. IXE experienced a significant 42.23% increase fueled by optimism about a return to more normal economic activity and high fossil fuel energy prices. All results are on a total return basis.
YTD Index Performance (Total Return Through September 30, 2021)

Over the past 12 months, QGRD was the best performer of the Nasdaq-Clean Edge indexes, increasing 49.98%, followed by HHO up 42.35%, CELS up 42.28%, and GWE up 23.10%. Over the same period, the S&P 500 experienced a 30.01% return and IXE was the top performer increasing 82.48% on a total return basis.
12-Month Index Performance (Total Return Through September 30, 2021)

First Trust ETFs tracking Nasdaq Clean Edge indexes equaled more than $4 billion in assets under management as of September 30, 2021.
DATA DIVE: CLEAN ENERGY LEADERS VS OIL MAJORS (MARKET CAP)
During the three-year period examined, all of the Clean Energy Leaders experienced growth in their market capitalizations, whereas the Oil Majors all declined. Tesla, which expanded from $45.2 billion in 2018 to $773.5 billion in 2021, now surpasses all five Oil Majors in total market capitalization. NextEra Energy’s 2021 market cap of $153.7 billion, up from $79 billion in 2018, exceeds that of Total and BP. Iberdrola grew from $46.5 billion in 2018 to $62.1 billion in 2021. Ørsted and Vestas, both based in Denmark, nearly doubled and tripled their market caps, respectively. Ørsted began at $28.5 billion and grew to $55.6 billion, while Vestas' market cap was $13.5 billion and expanded to $40.3 billion.

Even with a recent rebound in oil company valuations, Oil Majors have been under considerable pressure. During the three-year period tracked, BP's market cap shrunk by the largest percentage, from $154 billion to $91.8 billion (down 40%). Exxon Mobil, the largest of the Oil Majors, dropped 30% from $360 billion to $253.5 billion (with a market cap now three times smaller than Tesla’s). Shell fell to $172.8 billion from $286.6 billion (down 40%), while Chevron and Total declined about 15% and 25% respectively.
WINNERS AND LOSERS (INDEX CONSTITUENTS RANKED BY PRICE RETURN)
Below is a list of the top 10 best and worst constituent performers across all Clean Edge Nasdaq indexes (CELS, QGRD, HHO, and GWE) during Q3. Note: some of the best and worst constituents were added during the most recent semi-annual evaluation on September 20, 2021.
Best and Worst Constituents (Q3 2021)
Winners | Losers | ||
|---|---|---|---|
China Suntien Green Energy Corp., Ltd. | 85.84% | Workhorse Group, Inc. | -52.35% |
Concord New Energy Group Ltd. | 53.01% | CBAK Energy Technology, Inc. | -50.72% |
Vicor Corp. | 38.85% | Romeo Power, Inc. | -43.86% |
China Longyuan Power Group Corp. Ltd. | 33.53% | Sunworks, Inc. | -43.57% |
China Datang Corp. Renewable Power Co. Ltd. | 32.81% | ChargePoint Holdings, Inc. | -39.50% |
Rexnord Corp. | 32.12% | FTC Solar, Inc. | -37.44% |
Livent Corp. | 31.87% | AGL Energy Ltd. | -36.29% |
China High Speed Transmission Equipment Group Co., Ltd. | 30.89% | Lion Electric Co. | -35.56% |
Albemarle Corp. | 30.84% | Blink Charging Co. | -33.05% |
Quanta Services, Inc. | 26.06% | Bloom Energy Corp. | -32.51% |
QUARTERLY INSIGHT: PRICE VOLATILITY IS EMBEDDED IN FOSSIL FUELS
Oil spills, sky-high prices for natural gas, crude oil, and coal, and OPEC production caps have all been in the news of late – offering further proof of the perils of a fossil fuel-centric energy pathway. Fossil fuel is now clearly the riskiest of all energy future options, resulting in both climatic disaster and never-ending cycles of pricing volatility.
Price shocks are nothing new to the fossil fuel industry. In the parlance of a coder trying to cover up an issue with their software program, pricing volatility is “a feature, not a bug.” Not only are coal, oil, and natural gas the main contributors to greenhouse gas emissions, but because of their commodity nature, they are rife with both pricing and security implications. On the other hand, renewables, energy storage, and other clean technologies are seeing widespread price declines (via economies of scale and high-tech learning curves) – and for electricity production, they often have limited to no fuel costs. They offer a solution to both climate disruption and the never-ending cycle of fossil fuel pricing volatility – as well as the embedded risk of exporting nations exerting their will over import-dependent nations.
Some industry observers have expressed concern that high fossil fuel prices will make policymakers question the energy transition, but that’s not likely to play out. First and foremost, the current pricing issues are much more related to post-Covid-19 recovery pains (being experienced across almost all industries) than clean-energy adoption. It is also our belief that high prices for fossil fuels will speed up, not hinder, the energy transition. Electric vehicles (EVs) might offer the best illustration. Imagine a consumer looking to buy a new car while oil prices are at historic highs – do they buy the antiquated, gasoline-reliant internal combustion engine vehicle or select the innovation-packed, carbon-free EV option? The same goes for efficient heat pumps, utility-scale solar, and on and on.
We are approximately 25 years into a 50-year energy transition cycle from fossil fuels to clean-energy sources. While admittedly solar PV and modern wind turbine technology were pursued a bit earlier (as a direct result of the oil shortages of the 1970s), it was around the turn of the century that we began to see the mainstream development and financing of renewable energy sources. And it was ten years ago that renewables and storage began their rapid cost declines. The latter part of this transition will not be without growing pains (what transitions ever are?), but it is eminently preferable to the alternative of certain climatic disruption and endless cycles of energy price volatility. Moving forward, the challenge will be how to lessen and best manage fossil-fuel-induced energy shocks as the world transitions to clean energy, storage, and a resilient modernized grid.
Disclaimer:
The information contained above is provided for informational and educational purposes only. Clean Edge is not an investment adviser, and none of the information, including any Nasdaq Clean Edge index, should be construed as investment advice or relied on as the basis for making any kind of investment decision. Neither Clean Edge nor any of its affiliates makes any recommendation whatsoever to buy or sell any securities, fund, or financial product or any representation about the financial condition of any company, fund, or financial product. Information regarding any Clean Edge index is not a guarantee of future performance. Actual results may differ materially from those expressed or implied. Past performance is not indicative of future results and should never be relied upon for making any kind of investment decisions. Investors should undertake their own due diligence and carefully evaluate companies before investing. ADVICE FROM A SECURITIES PROFESSIONAL IS STRONGLY ADVISED.

