

By: Ron Pernick

Quarterly overview of stock index performance and the top trends impacting the state of clean tech.
2022 was a volatile and difficult year, punctuated by high commodity prices, massive supply disruptions, and continued lockdowns in China. But the coup de grace, as governments, companies, and individuals worked to recover from the Covid-19 pandemic, was Russia’s invasion of Ukraine. This destructive and unjustified act left the European continent and world on edge and roiled oil, gas, and food markets from London to Lagos. It was a trying year by all accounts.
From an energy perspective, an overarching question is whether Russia’s war on Ukraine will speed or slow the energy transition. In the short term, the fossil fuel sector saw a surge in demand, and a significant increase in commodity and end-product pricing, as European countries scrambled to find alternatives to Russian natural gas (see stock index performance comparisons below). But based on a range of factors, we see the energy transition speeding up, not slowing down. Because of key factors like low-cost renewables (solar and wind are the most cost-competitive forms of new electricity capacity additions in most geographies) and supportive energy and climate policies such as the U.S.’s Inflation Reduction Act (IRA), we don’t foresee a repeat of past fossil fuel resurgences in the face of volatility and uncertainty. Instead, Putin’s petro-dictator muscle flexing is almost certain to backfire, as a host of nations, from China and India to the U.S. and Europe, work to embolden their clean-tech capacities and aggressively scale up clean-energy manufacturing and deployment.
As of December 31, 2022 (Total Return) | CELS (U.S. Clean Energy) | GWE (Global Wind) | HHO (U.S. Water) | QGRD (Global Grid) | S&P 500 | IXE (Energy Select) |
|---|---|---|---|---|---|---|
Q4 | -16.87% | 14.51% | 11.08% | 15.81% | 7.56% | 22.86% |
12-Month | -30.15% | -12.79% | -15.17% | -13.34% | -18.11% | 64.56% |
Against this backdrop, IXE (Energy Select which benchmarks oil and gas) continued to outperform, up 64.56% for the full year on a total return basis. CELS (U.S. clean energy) declined 30.15% during the period, its largest annual decline in more than a decade. For the year, GWE (global wind) was down 12.79%, infrastructure-focused QGRD (global smart grid & grid infrastructure) declined 13.34% and HHO (U.S. water) was down 15.17%, all beating out the S&P 500 decline of 18.11%.
2022 Full Year Index Performance (Total Return)
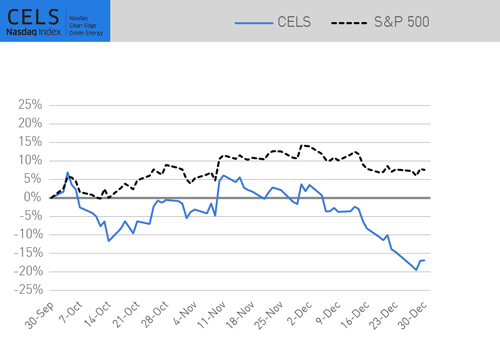
In Q4 2022, on a total return basis, CELS was down 16.87%, continuing its underperformance. During the quarter, however, QGRD, GWE, and HHO were up 15.81%, 14.51%, and 11.08% respectively, compared to the S&P 500’s 7.56% increase. During the same timeframe, IXE rose 22.86%.
Q4 2022 Index Performance (Total Return)
First Trust ETFs and UCITS tracking Nasdaq Clean Edge indexes equaled more than $4 billion in assets under management as of January 12, 2023.
DATA DIVE: CLEAN ENERGY OUTPERFORMS TRADITIONAL ENERGY (CEXX VS IXETR) OVER THE PAST DECADE
The energy sector has long been a core barometer of industrial activity and an important area for investors to track, but the sector and its related indexes, as historically defined, have contained mostly fossil fuel companies. Based on this narrow definition of energy, it’s important to compare both traditional energy and emerging energy transition players. While conventional energy indexes have provided outsized returns over the past two years, renewable energy has dramatically outperformed traditional energy over the past decade. During the last 10 years, IXETR (the Energy Select Sector Total Return Index of S&P 500 companies involved in the development or production of energy products – namely oil and gas) has grown 79.6% on a total return basis. Compare this to CEXX, the Nasdaq Clean Edge Green Energy Index, which increased 436.1% on a total return basis over the same time frame.

Renewable energy’s market performance is good news for both investors and the global energy transition. However, this transition will be bumpy – for example, both 2021 and 2022 saw losses in the renewable energy market due to headwinds including Covid-related supply chain disruptions, higher interest rates, and geopolitical instability. Despite the recent two years of losses, CEXX has outperformed IXETR for seven of the last 10 years. More broadly, the clean-energy sector has outperformed 10 of the 11 stock market sectors (as classified by GICS, the Global Industry Classification Standard) over the past decade, including Healthcare (+306.3%), Financials (+215.1%) and Industrials (+209.0%). It has produced returns comparable to Information Technology (+438.0%), the best-performing sector.
WINNERS AND LOSERS (INDEX CONSTITUENTS RANKED BY PRICE RETURN)
Below is a list of the top 10 best and worst constituent performers across the following Clean Edge Nasdaq indexes (CELS, QGRD, HHO, and GWE) during 2022.
Best and Worst Constituents (2022)
Winners | Losers | ||
|---|---|---|---|
PNE AG | 137.98% | Volta, Inc. | -95.16% |
First Solar, Inc. | 71.86% | Tritium DCFC Limited | -83.15% |
SMA Solar Technology AG | 68.45% | Rivian Automotive, Inc. | -82.23% |
Sociedad Química y Minera de Chile S.A. | 58.32% | Lucid Group, Inc. | -82.05% |
Digi International, Inc. | 48.76% | Aeris Indústria e Comércio de Equipamentos para Geração de Energia S.A. | -81.68% |
Companhia de Saneamento Básico do Estado de São Paulo S.A | 45.23% | Navitas Semiconductor Corp. | -79.37% |
Enphase Energy, Inc. | 44.83% | ESS Tech, Inc. | -78.76% |
Terna Energy S.A. | 40.84% | Wallbox N.V. | -78.09% |
Chung-Hsin Electric & Machinery Manufacturing Corp. | 33.68% | Lion Electric Co. | -77.46% |
Valmont Industries, Inc. | 32.00% | Azure Power Global Ltd. | -75.59% |
QUARTERLY INSIGHT: TRENDS TO WATCH IN 2023
Looking ahead, what will 2023 bring? Below are some of the top trends we expect to see in the year ahead:
- Inflationary pressures on EVs will ease. Clean energy and the broader clean tech industry have been built off the promise of ever-declining prices. The learning curve for the solar power industry, for example, is around 18%; for every doubling of manufacturing output, the cost of manufacturing a solar panel has historically declined by about 18%. That’s why solar PV module costs have declined nearly 89% over the past decade. And we’ve seen similar cost declines in the energy storage sector. While prices for solar, wind, energy storage, lithium, and EVs all increased in 2022, we expect to see prices start to temper and correct back to their earlier declines. On the energy storage front, Bloomberg New Energy Finance tracked the first increase in pricing in more than a decade in 2022, up 7% over 2021. However, the firm predicts that prices will continue their decline and reach a projected $100/kWh by 2026 (down from $151/kWh in 2022). This should result in lower EV prices, albeit later than initially projected. Tesla has already announced price reductions of up to 20% on certain models in the U.S. in early 2023 – many of them to meet the consumer incentives embedded in the IRA and to compete more aggressively to maintain market share. As EVs become increasingly commonplace and gain market share, we expect their prices to become more commensurate with their internal combustion-powered brethren.
- The down-to-earth heat pump will reign. The heat pump is finally having its moment. Although heat pumps have been popular in Japan and Scandinavia for years, they are just starting to take off in the U.S. and across other European countries (full disclosure, I’ve had one in my home office in Portland, Oregon, for more than a decade). There are two major drivers at the forefront of the heat pump’s recent rise in popularity. In Europe, as governments, businesses, and homeowners scramble to find alternatives to natural gas use, they’ve been turning to heat pumps, which run on electricity and are highly efficient. The heat pump as an energy security symbol is a relatively new phenomenon, but preliminary sales figures show that three million heat pumps were sold in Europe in 2022 – doubling 2019 sales. In the U.S., the Inflation Reduction Act began covering 30% of the cost, up to $2,000, for the purchase of a heat pump starting January 1. Sales are expected to surge. Heat pumps save consumers money for heating and cooling (contrary to the name, they do both), and from a cost savings and carbon-reduction perspective, they’re probably the product that offers the best bang for one’s buck.
- China’s dominance of the clean-tech supply chain will peak. Reliable industrial supply chains take years to develop, and China has been at the forefront of both identifying the clean-tech opportunity and fulfilling its promise. According to the International Energy Agency, China currently leads the world in the manufacturing and production of solar panels, wind turbines, EV batteries, electrolyzers, and heat pumps. But something rather remarkable is happening. The U.S. passed the Inflation Reduction Act, offering the promise of building a robust, reliable, and competitive domestic ecosystem for the clean-tech industries of the future – spanning energy storage, renewables, EVs, enabling materials, and grid infrastructure. Rather than primarily using sticks (penalties and regulations), the policy is focused on carrots (namely manufacturing and production tax credits and consumer tax credits and rebates). The IRA is already paying dividends, with tens of billions in corporate commitments announced to build U.S.-based mining, EV, energy storage, and solar production and manufacturing facilities. Since the IRA’s passage last summer, companies that have made significant announcements include First Solar, Form Energy, Hanwha Qcells, Honda, LG Chem, Piedmont Lithium, Tesla, and Toyota.
Disclaimer:
The information contained above is provided for informational and educational purposes only. Clean Edge is not an investment adviser, and none of the information, including any Nasdaq Clean Edge index, should be construed as investment advice or relied on as the basis for making any kind of investment decision. Neither Clean Edge nor any of its affiliates makes any recommendation whatsoever to buy or sell any securities, fund, or financial product or any representation about the financial condition of any company, fund, or financial product. Information regarding any Clean Edge index is not a guarantee of future performance. Actual results may differ materially from those expressed or implied. Past performance is not indicative of future results and should never be relied upon for making any kind of investment decisions. Investors should undertake their own due diligence and carefully evaluate companies before investing. ADVICE FROM A SECURITIES PROFESSIONAL IS STRONGLY ADVISED.