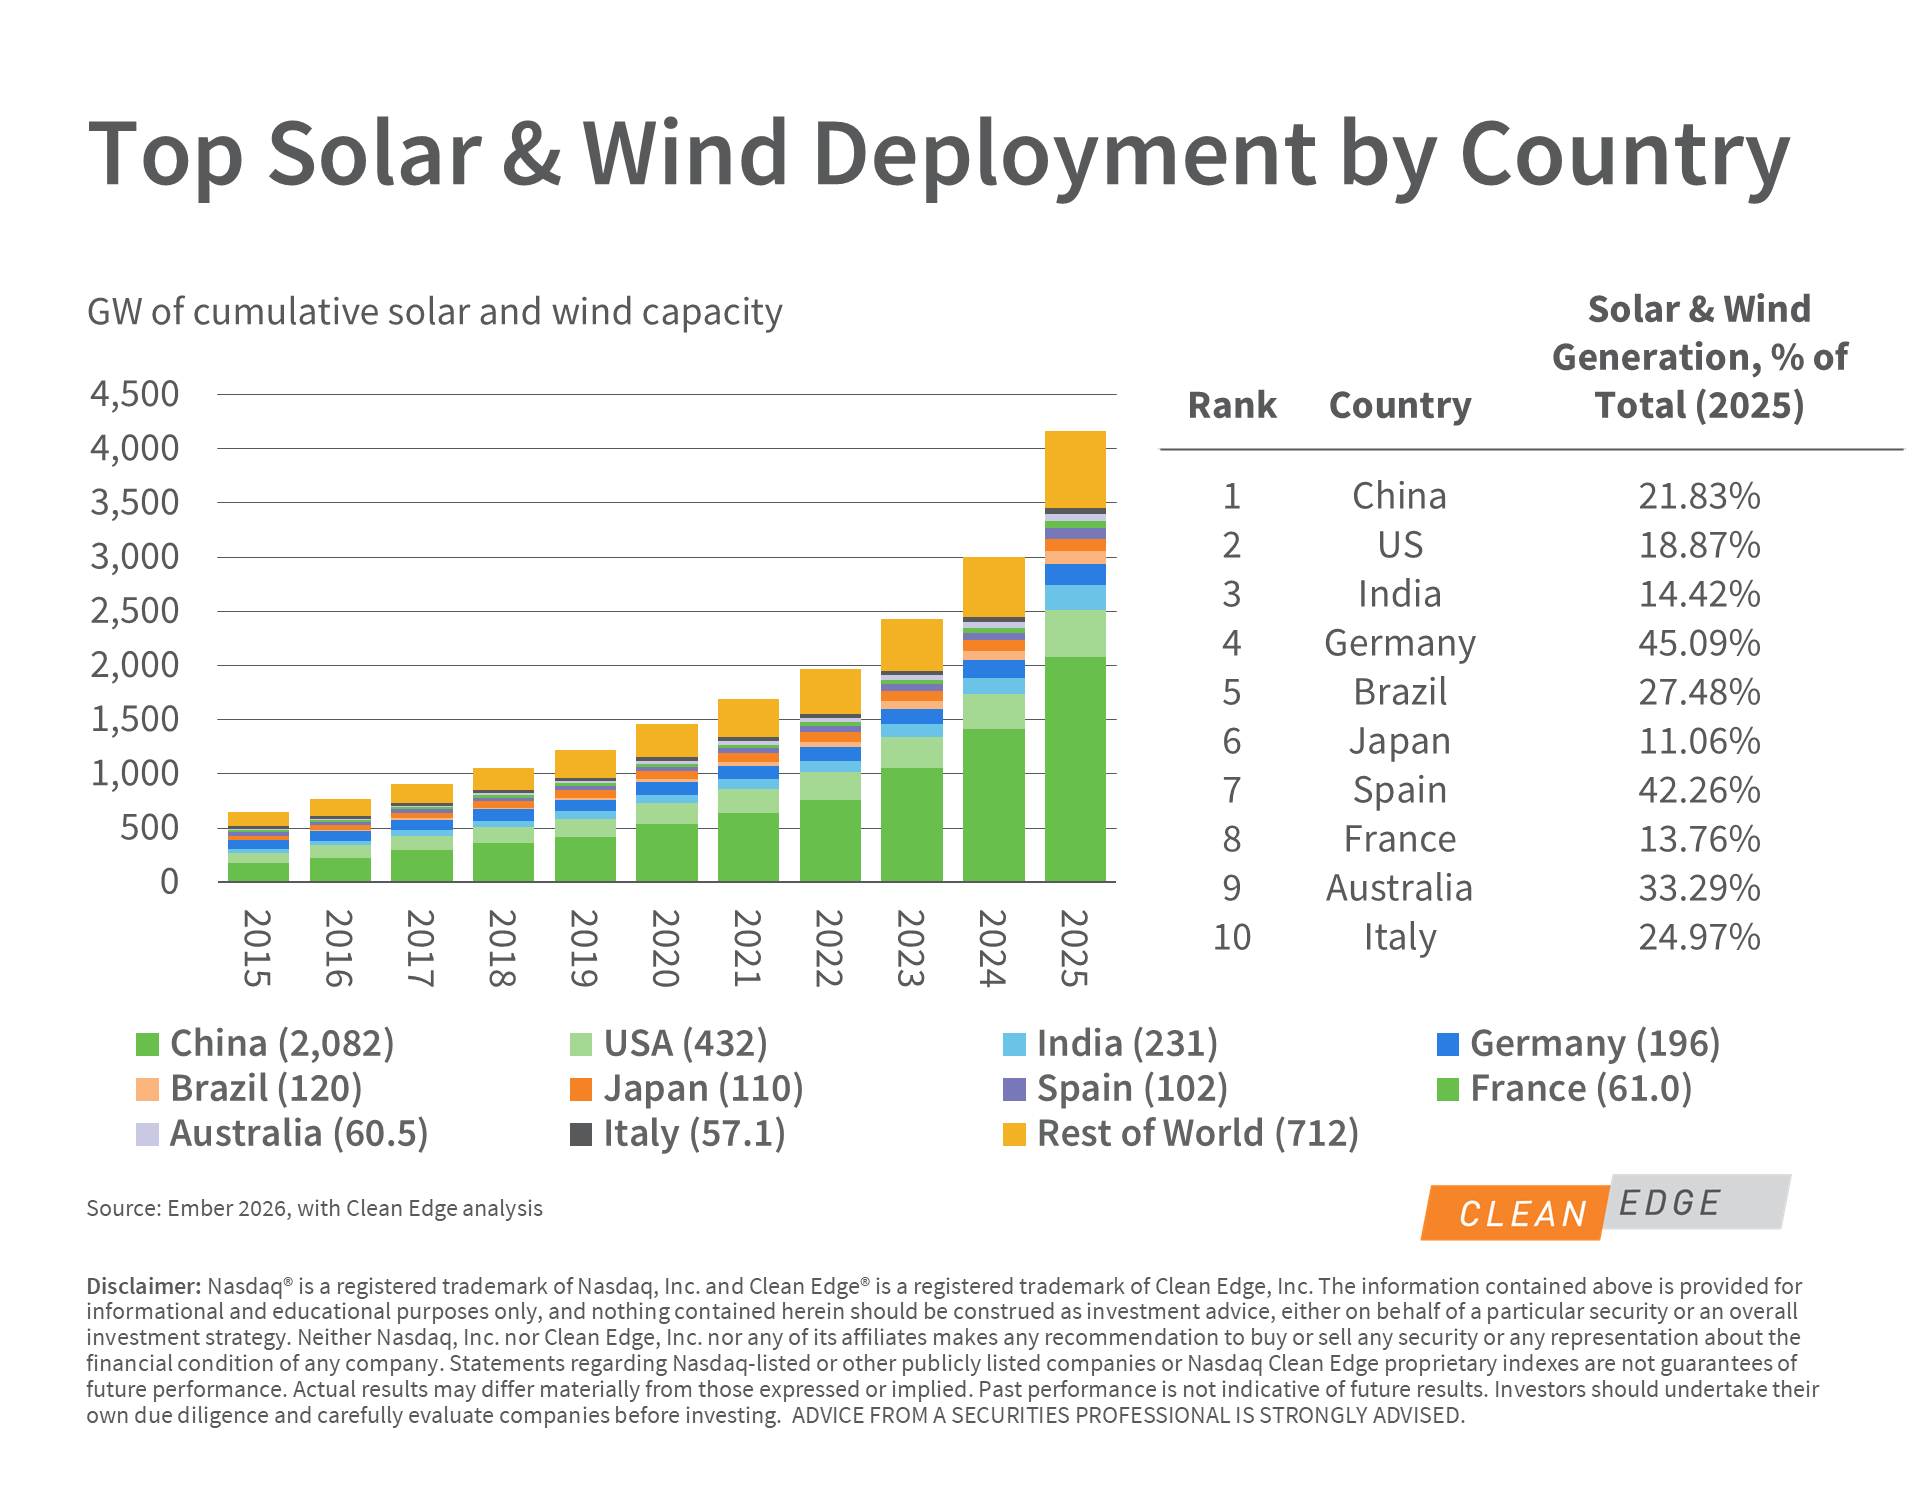
Global renewable energy deployment continued its robust growth in 2025, with utility-scale solar and wind capacity increasing by a near-record 39% to 4.2 TW. Solar and wind continued to dominate, representing 86.7% of new global electric generation capacity additions in 2025, according to IRENA. Combined solar and wind capacity has grown more than 6x between 2015 and 2025. China now accounts for more than half of the world’s installed solar and wind capacity with nearly 2.1 TW deployed by the end of 2025 – more than the entire capacity of the U.S. China also hit a domestic milestone last year, generating more than a fifth of its total electricity from solar and wind (in the U.S. it was 18.87%). More than 1 TW of new solar capacity was added globally, accounting for more than 75% of all new renewables installed. The IEA predicts that the world will build an additional 5.5 TW of renewable capacity between 2024 and 2030, with around 80% expected to come from solar. Three of the top countries in total generating capacity – Germany, Spain, and Australia– were also among the world leaders in percentage of domestic generation from wind and solar at 45.09%, 42.26%, and 33.29%, respectively.