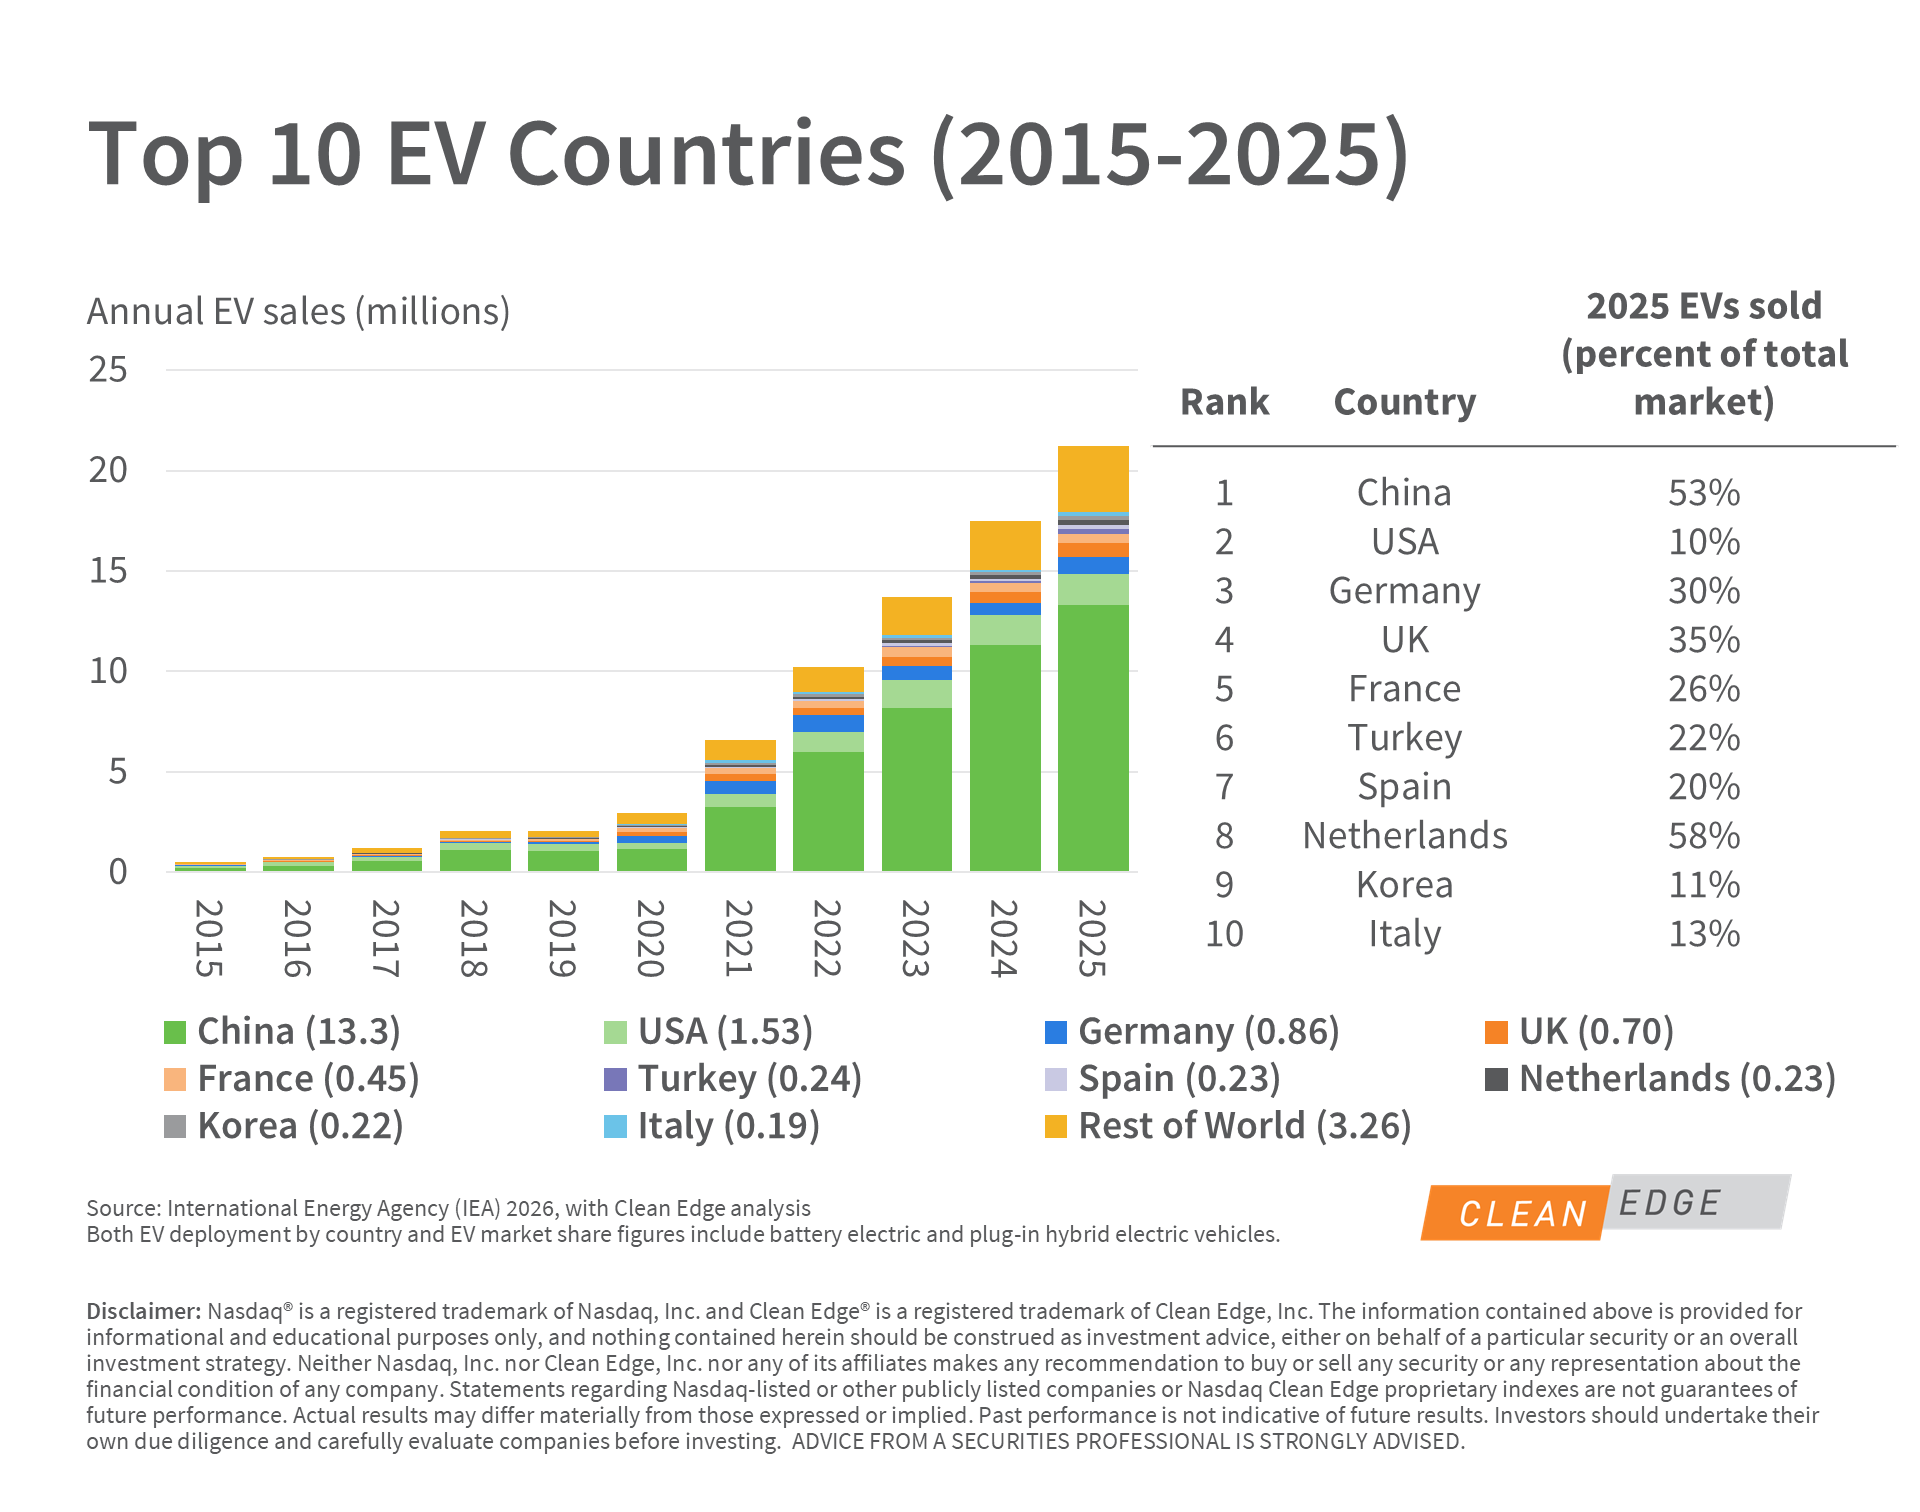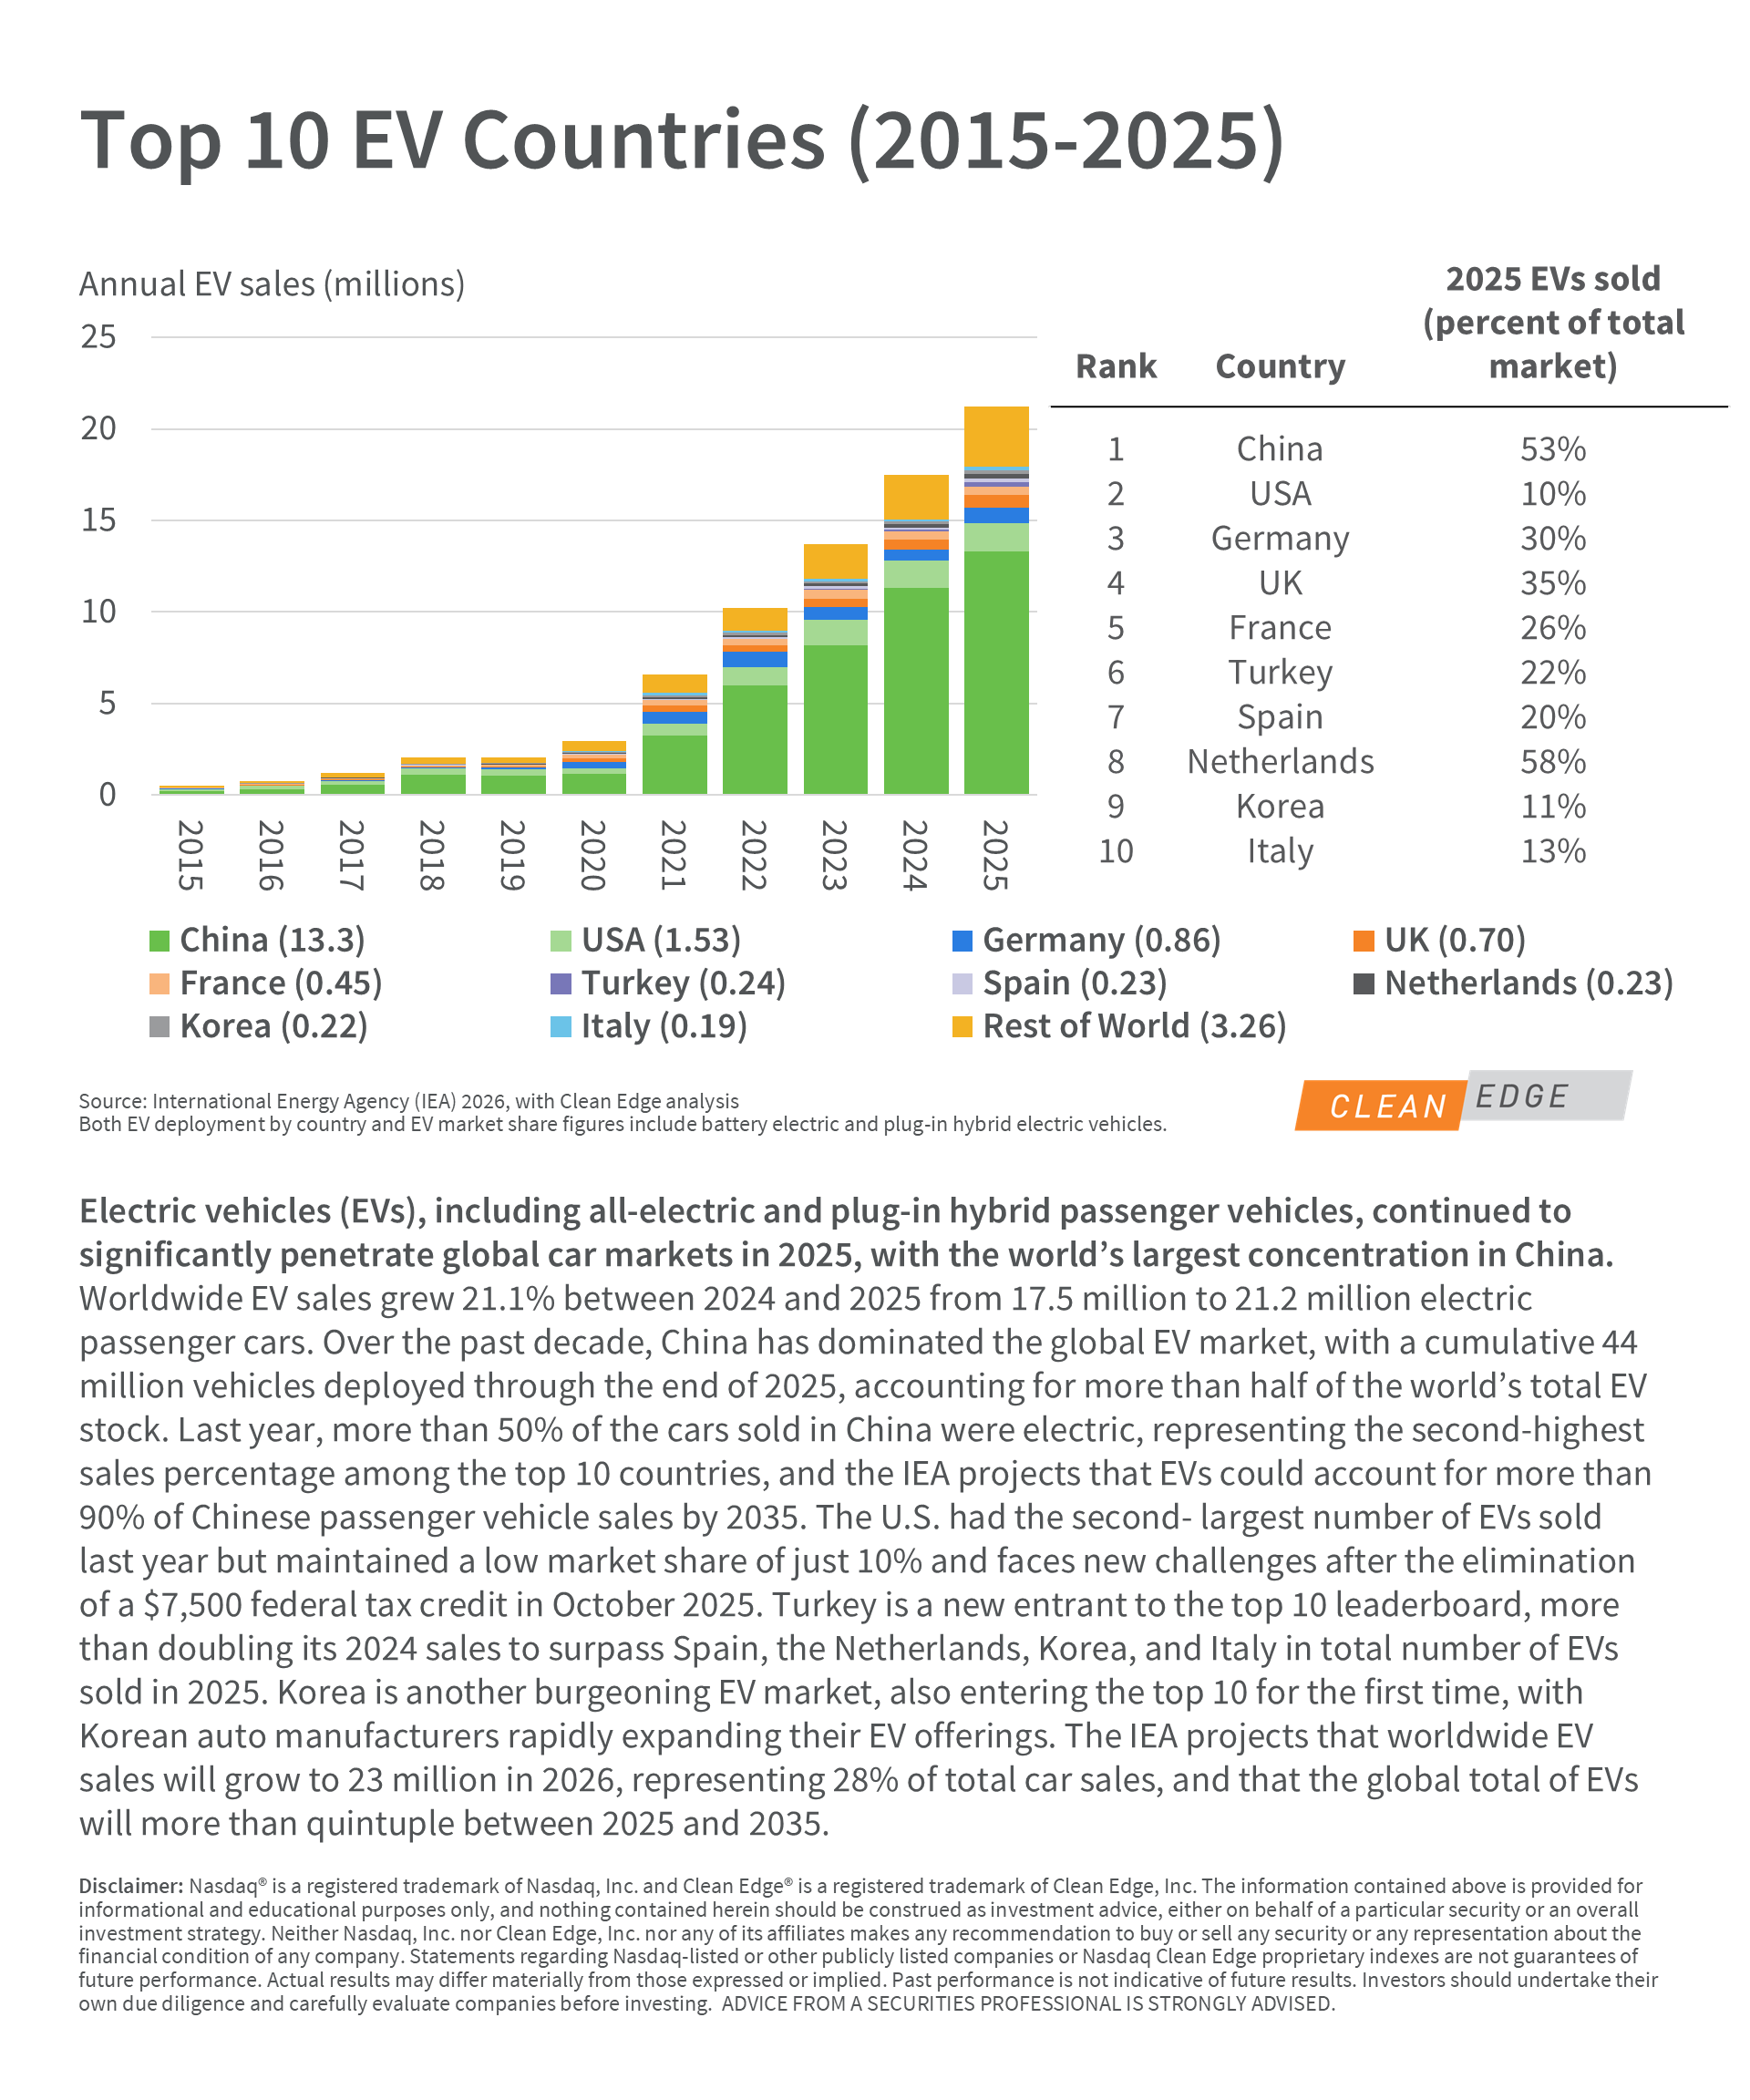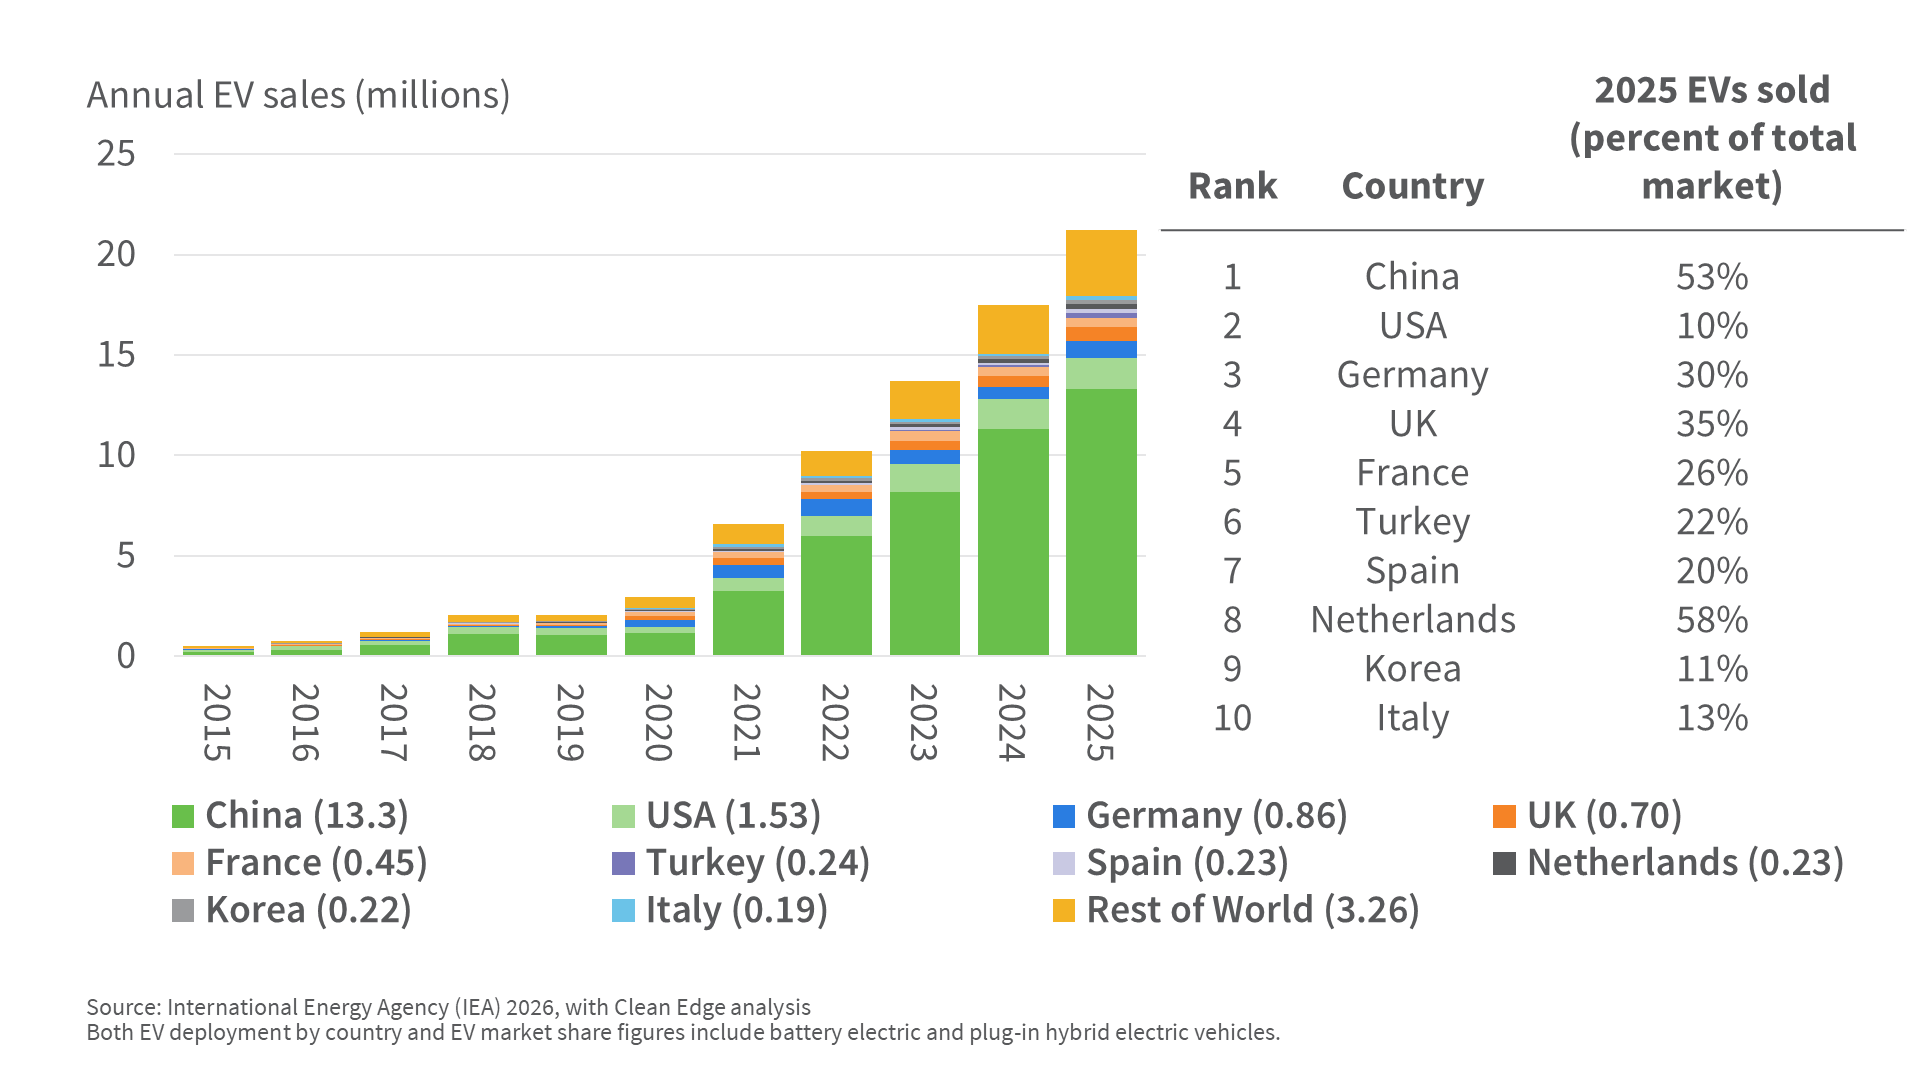
Electric vehicles (EVs), including all-electric and plug-in hybrid passenger vehicles, continued to significantly penetrate global car markets in 2025, with the world’s largest concentration in China. Worldwide EV sales grew 21.1% between 2024 and 2025 from 17.5 million to 21.2 million electric passenger cars. Over the past decade, China has dominated the global EV market, with a cumulative 44 million vehicles deployed through the end of 2025, accounting for more than half of the world’s total EV stock. Last year, more than 50% of the cars sold in China were electric, representing the second-highest sales percentage among the top 10 countries, and the IEA projects that EVs could account for more than 90% of Chinese passenger vehicle sales by 2035. The U.S. had the second- largest number of EVs sold last year but maintained a low market share of just 10% and faces new challenges after the elimination of a $7,500 federal tax credit in October 2025. Turkey is a new entrant to the top 10 leaderboard, more than doubling its 2024 sales to surpass Spain, the Netherlands, Korea, and Italy in total number of EVs sold in 2025. Korea is another burgeoning EV market, also entering the top 10 for the first time, with Korean auto manufacturers rapidly expanding their EV offerings. The IEA projects that worldwide EV sales will grow to 23 million in 2026, representing 28% of total car sales, and that the global total of EVs will more than quintuple between 2025 and 2035.