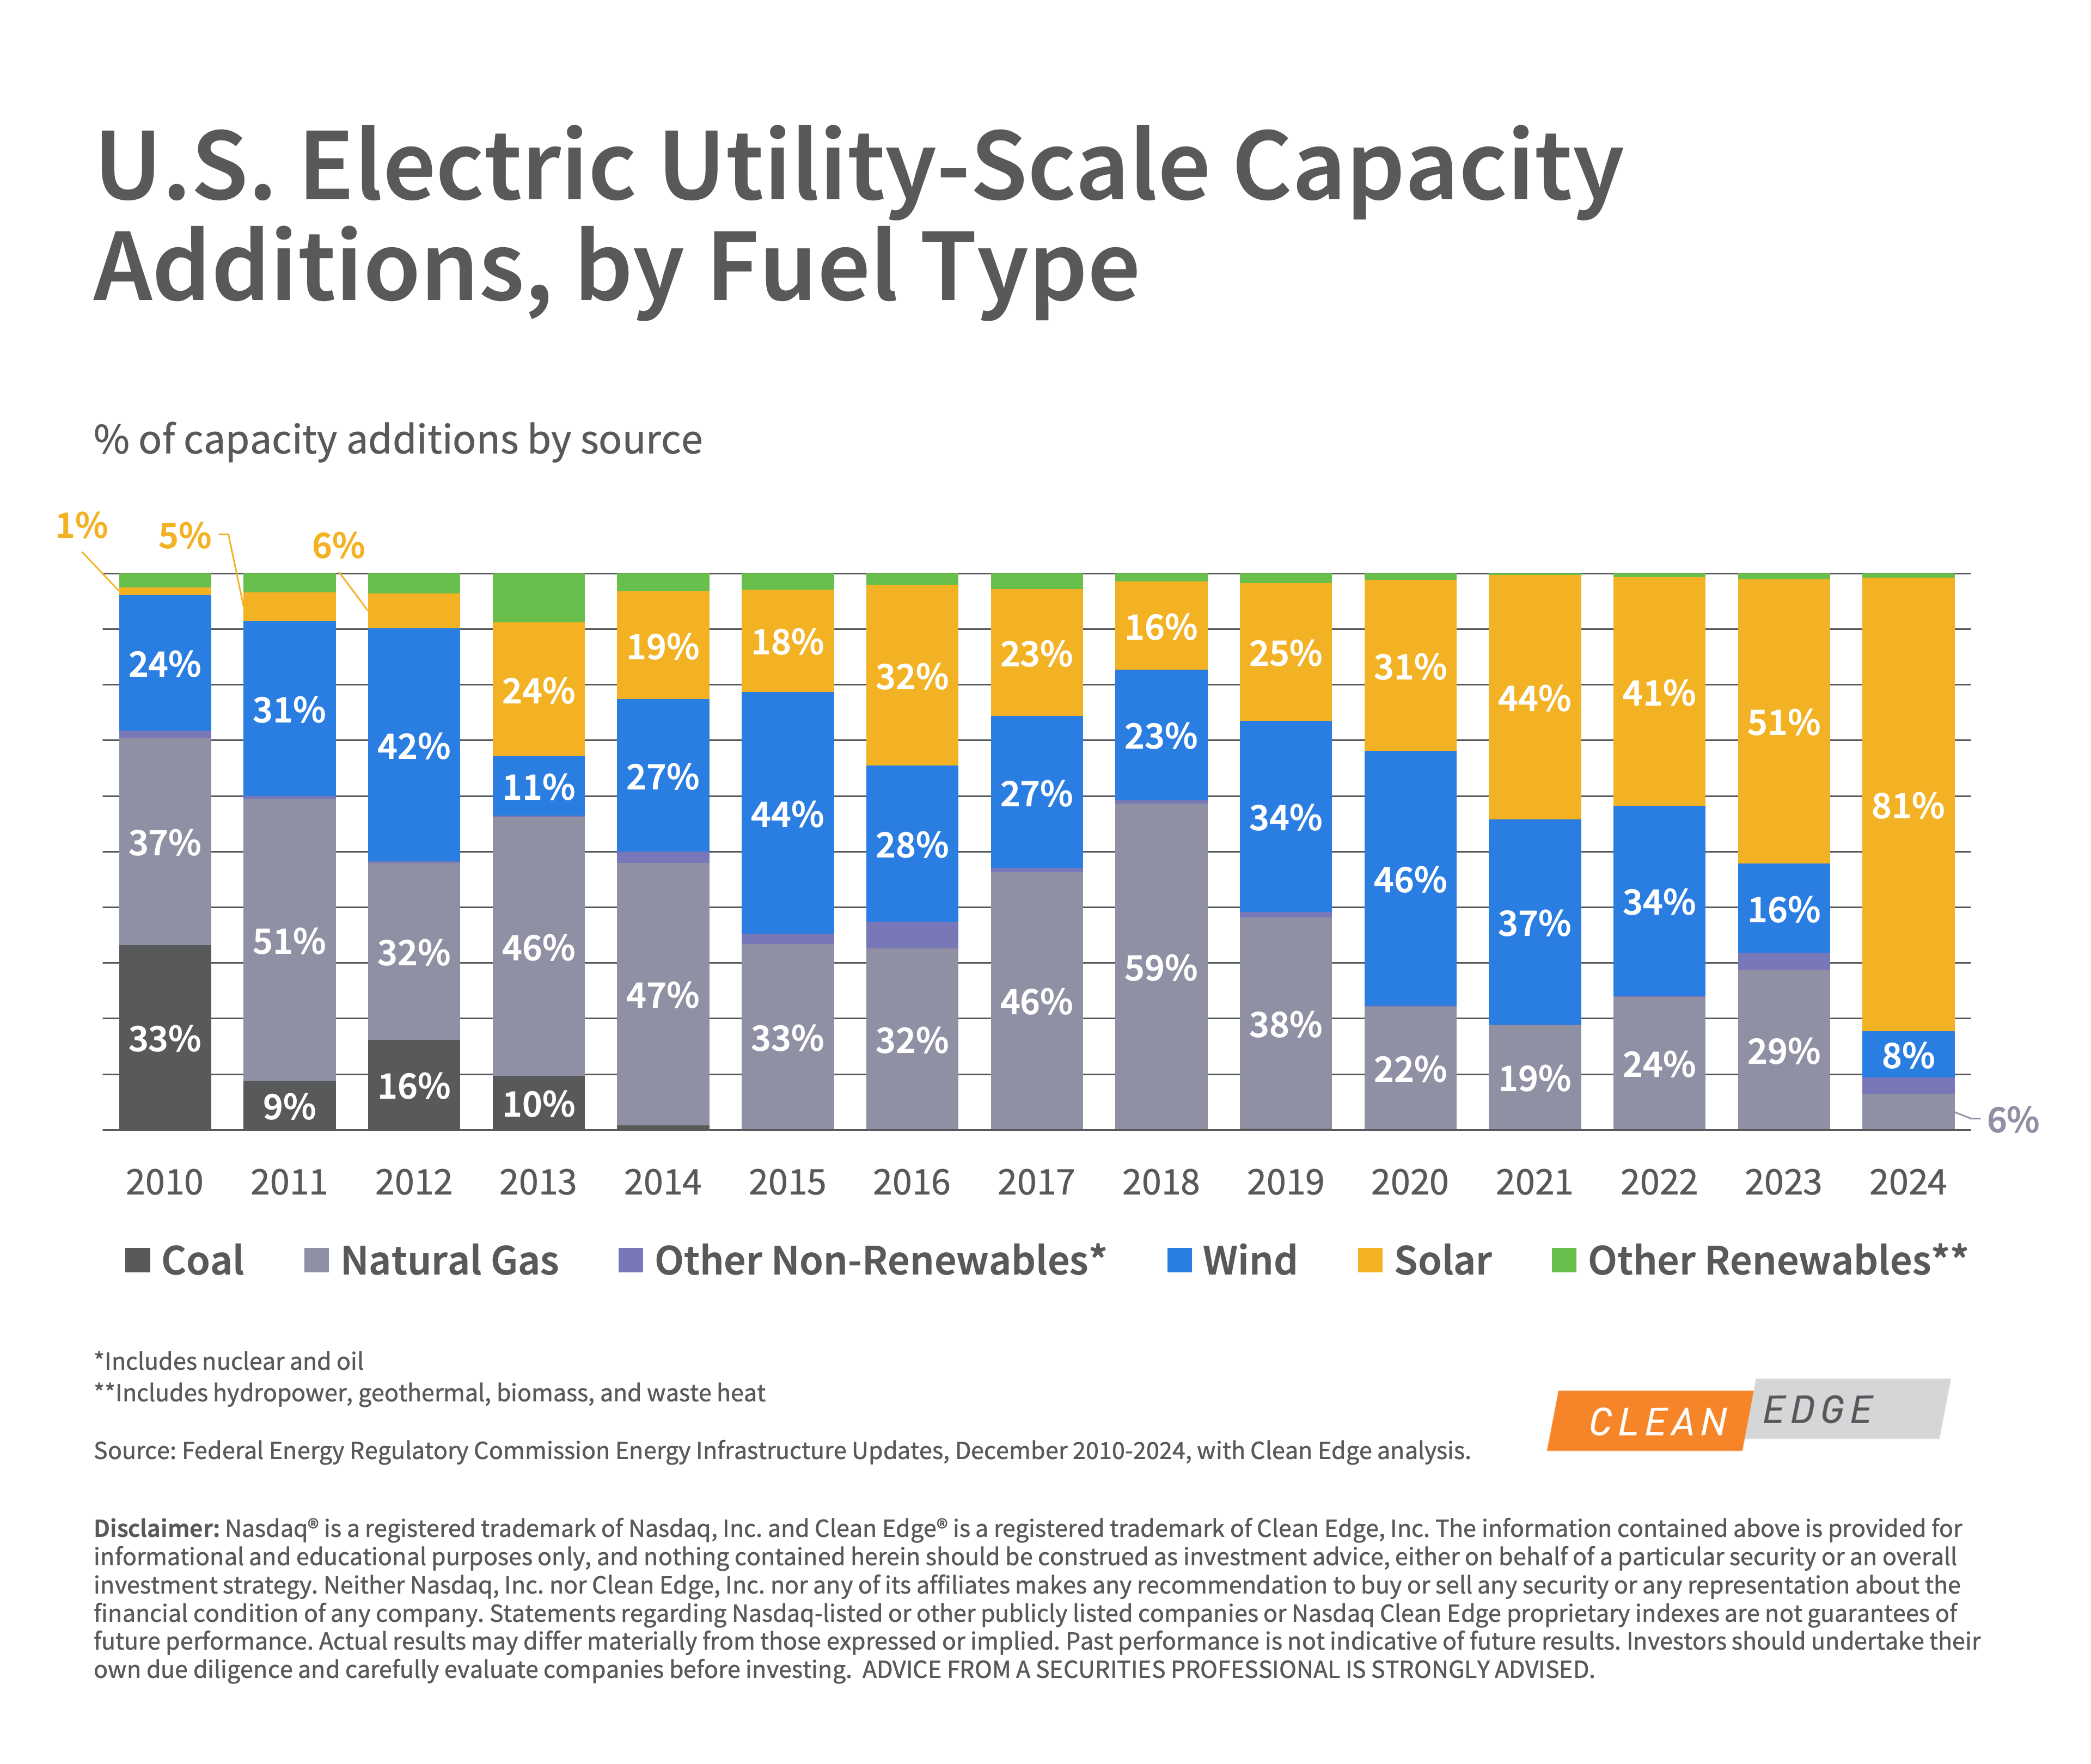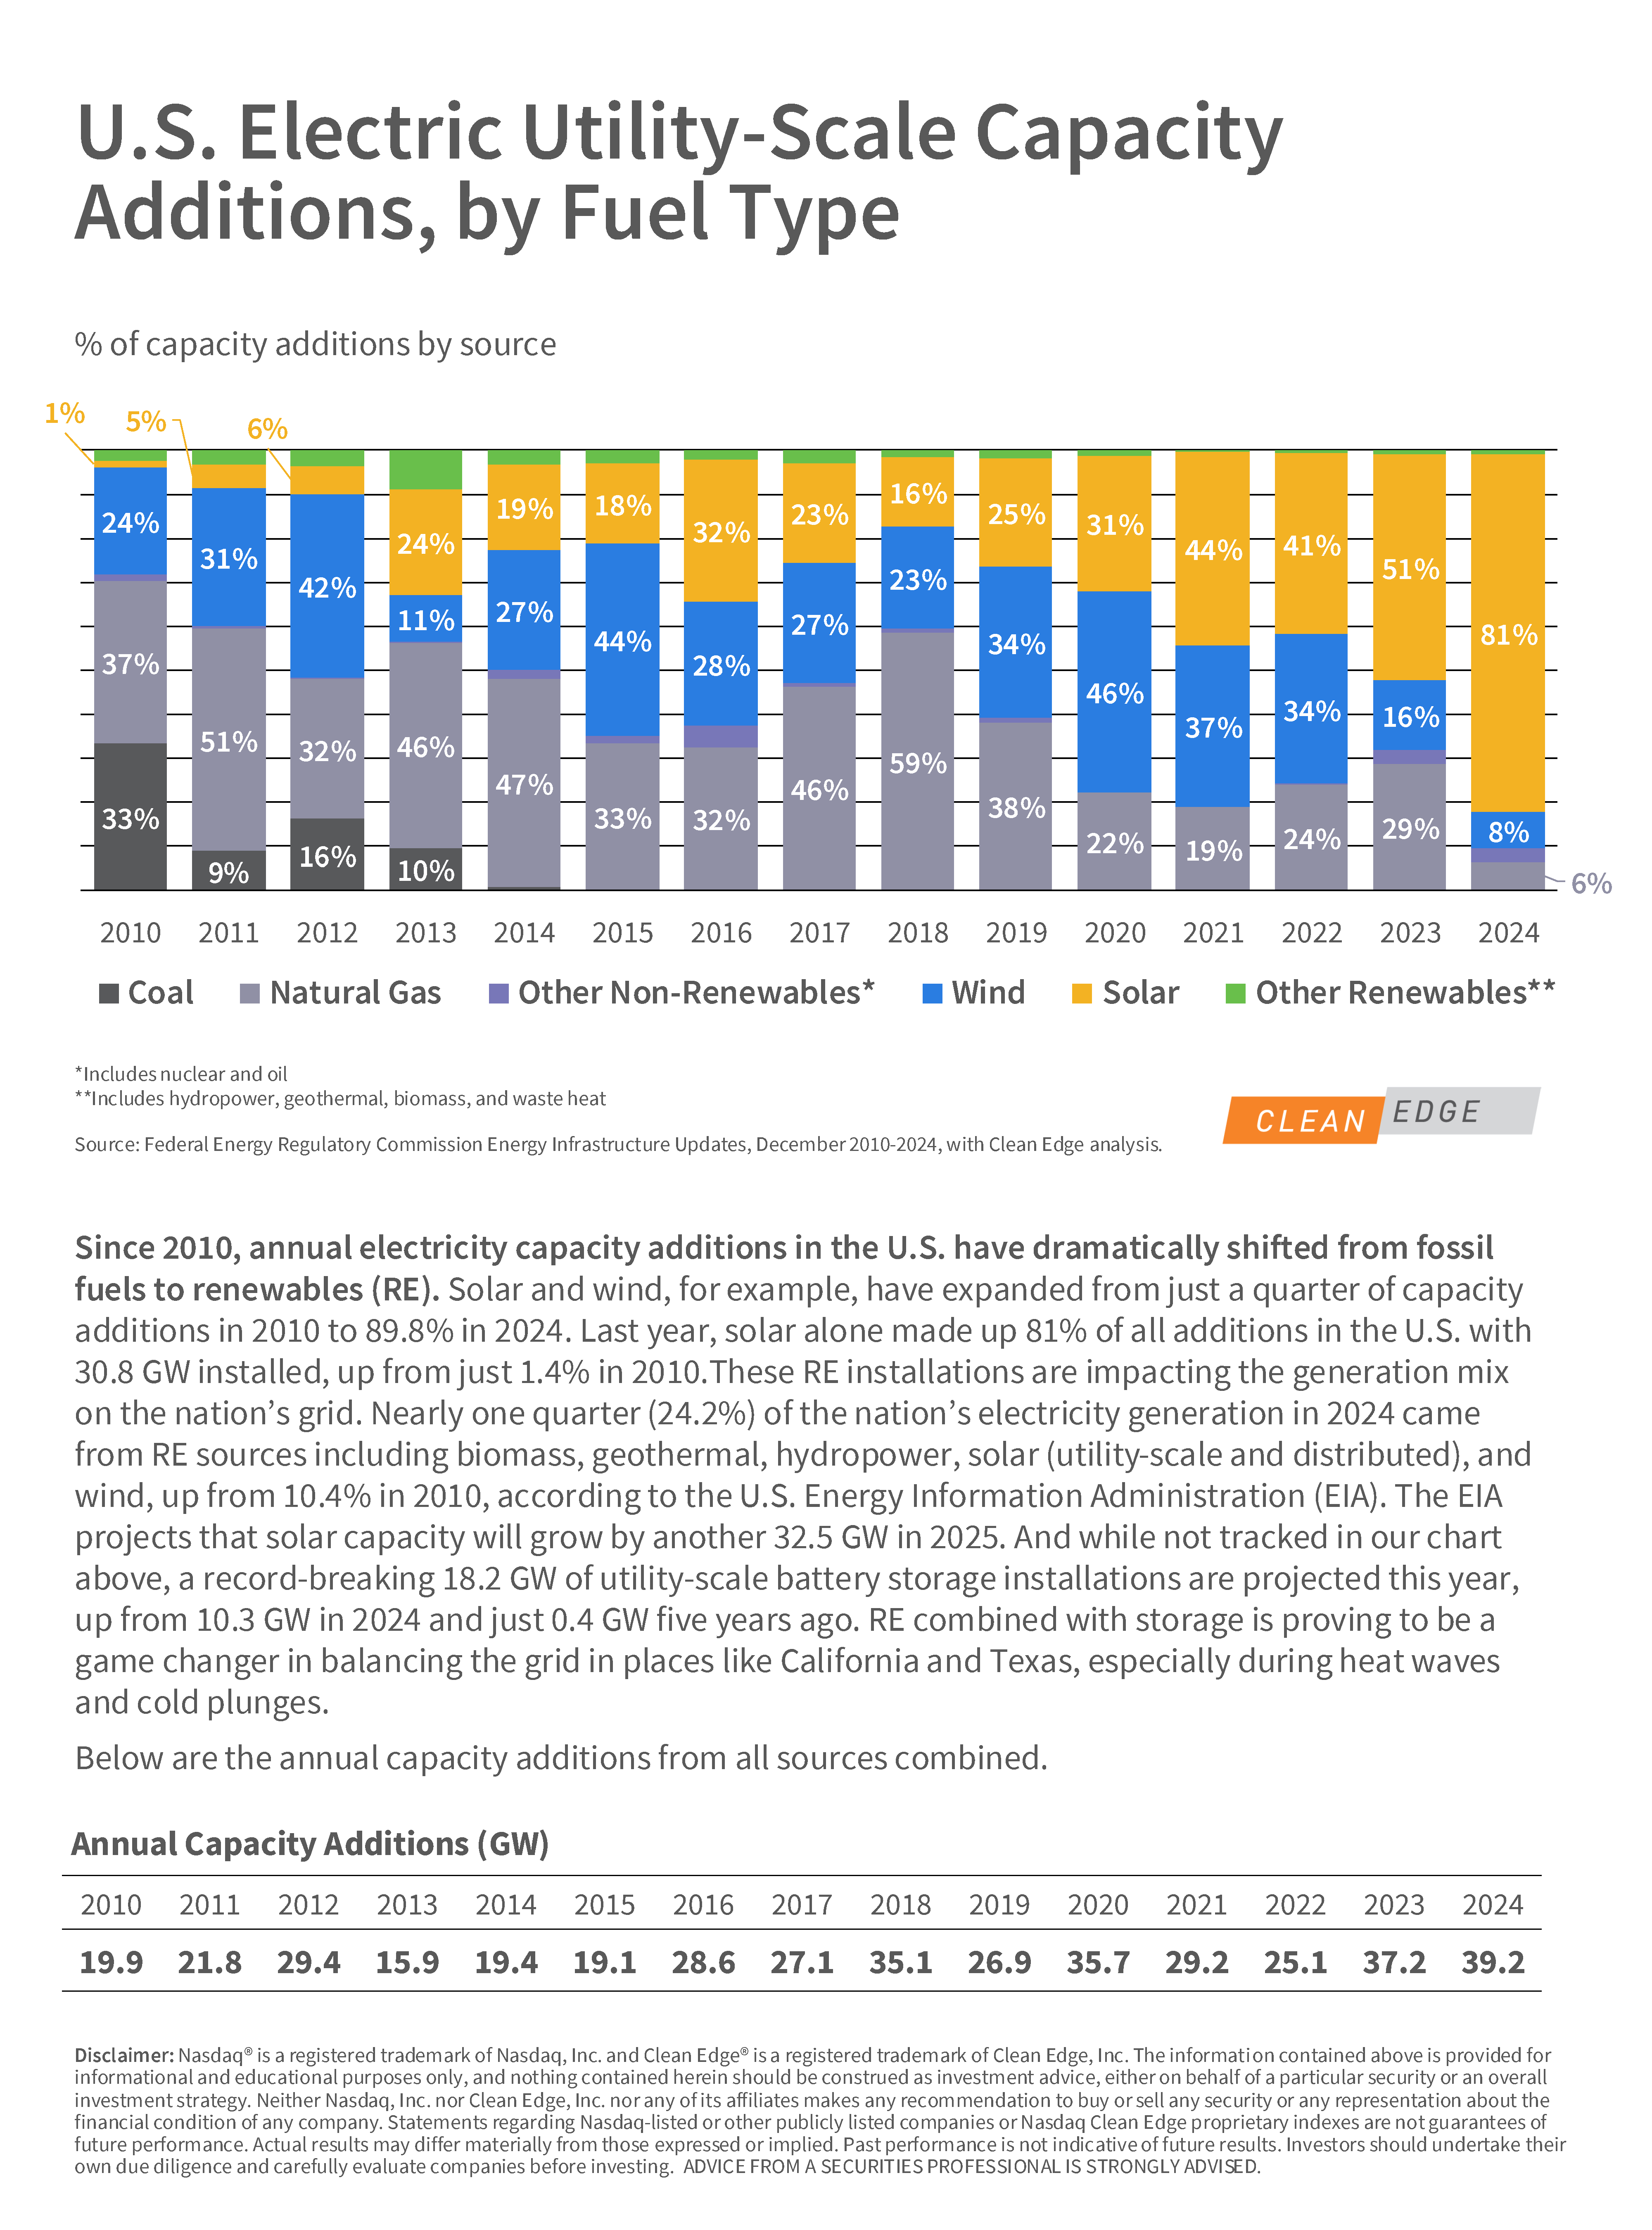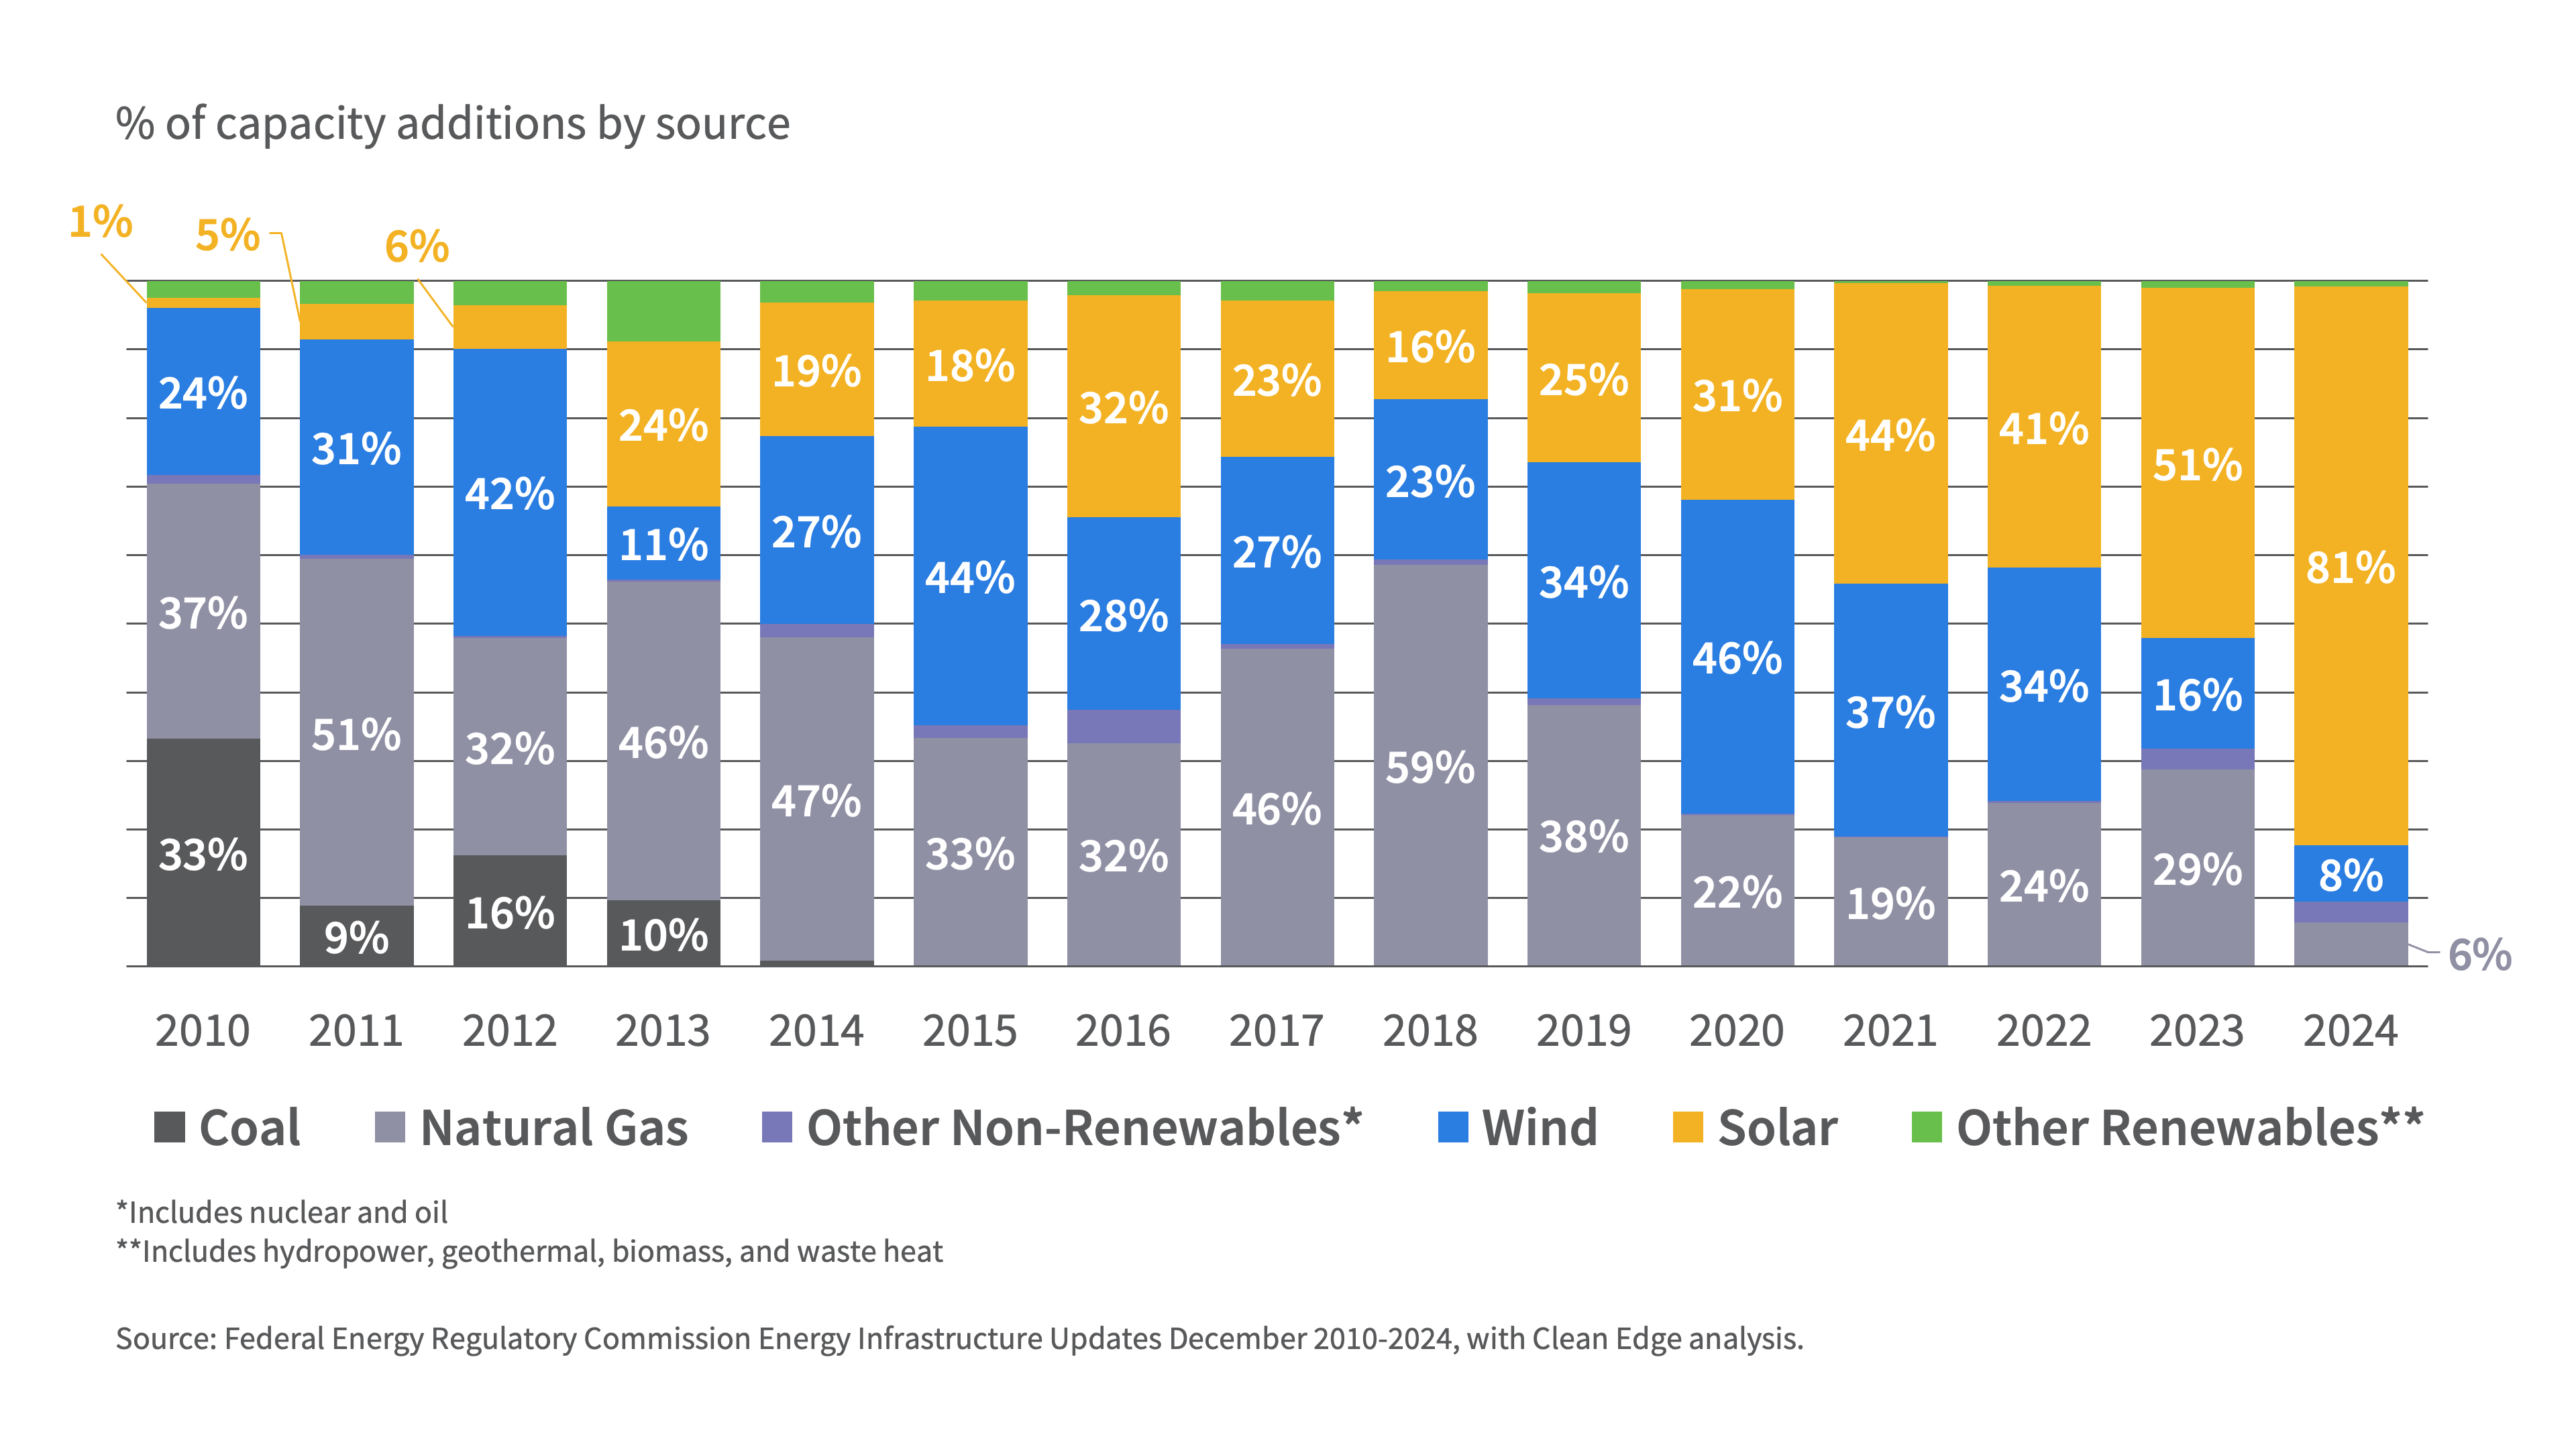
Since 2010, annual electricity capacity additions in the U.S. have dramatically shifted from fossil fuels to renewables (RE). Solar and wind, for example, have expanded from just a quarter of capacity additions in 2010 to 89.8% in 2024. Last year, solar alone made up 81% of all additions in the U.S. with 30.8 GW installed, up from just 1.4% in 2010. These RE installations are impacting the generation mix on the nation’s grid. Nearly one quarter (24.2%) of the nation’s electricity generation in 2024 came from RE sources including biomass, geothermal, hydropower, solar (utility-scale and distributed), and wind, up from 10.4% in 2010, according to the U.S. Energy Information Administration (EIA). The EIA projects that solar capacity will grow by another 32.5 GW in 2025. And while not tracked in our chart above, a record-breaking 18.2 GW of utility-scale battery storage installations are projected this year, up from 10.3 GW in 2024 and just 0.4 GW five years ago. RE combined with storage is proving to be a game changer in balancing the grid in places like California and Texas, especially during heat waves and cold plunges.