

Q1 2024 Review
By: Ron Pernick

Quarterly overview of index performance, constituent winners and losers, latest Data Dives, and more
In the first quarter of 2024, the Nasdaq Clean Edge index suite continued to exhibit divergent performance between infrastructure and clean-energy-focused indexes. In recent quarters, our infrastructure-oriented grid, water, and income indexes have primarily posted quarterly gains, whereas clean-energy indexes have mostly notched declines.
As of March 28, 2024 | CELS™ (U.S. Clean Energy) | GWE™ (Global Wind) | HHO™ (U.S. Water) | QGRD™ (Global Grid) | CELSI™ (Ex-U.S. Clean Energy) | GGINC™ (Global Green Income) | S&P 500 | IXE (Energy Select) |
|---|---|---|---|---|---|---|---|---|
Q1 2024 | -17.78% | -6.46% | 7.92% | 9.62% | -2.10% | 1.52% | 10.56% | 13.55% |
12-Month | -33.09% | -11.65% | 23.73% | 19.61% | -1.12% | 10.01% | 29.88% | 18.03% |
Source: Nasdaq, Bloomberg. Performance calculated using total return symbols (CEXX™, GWETR™, HHOTR™, QGDX™, GGINCT™, SPXT, and IXETR respectively) through 3/28/2024.
On a total return basis, QGRD™ (global smart grid & grid infrastructure), HHO™ (U.S. water), and GGINC™ (global green income) were up 9.62%, 7.92%, and 1.52%, respectively for the quarter, while CELS™ (U.S. clean energy), GWE™ (global wind) and CELSI™ (ex-U.S. clean energy) were down 17.78%, 6.46%, and 2.10%, respectively for the quarter. IXE (energy select) was up 13.55% during the same period while the S&P 500 increased 10.56%.
Q1 2024 Index Performance (Total Return)
Over a 12-month period (through the end of March 28, 2024), on a total return basis, CELS was down 33.09%, GWE declined 11.65%, and CELSI was off 1.12%. During the same period, QGRD and HHO were up 19.61% and 23.73%, respectively, beating out IXE, up 18.03%, while GGINC increased 10.01% and the S&P rose 29.88%.
TTM Index Performance (Total Return)
First Trust ETFs and UCITS tracking Nasdaq Clean Edge indexes equaled more than $3.5 billion in assets under management as of April 15, 2024.
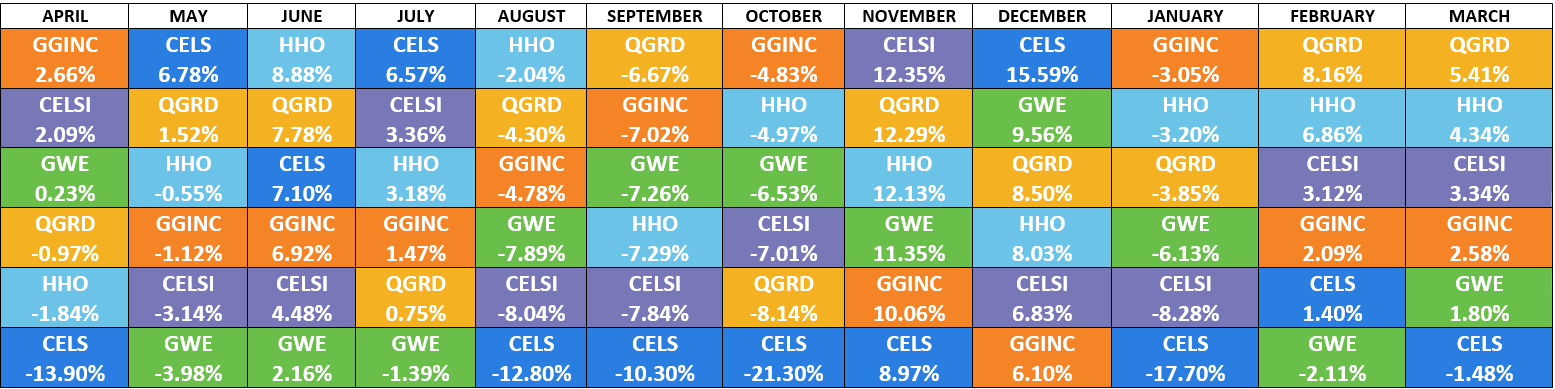
MONTHLY THEMATIC INDEX RETURNS (%) – 12 MONTH PERIOD
Across all six Nasdaq Clean Edge indexes, on a monthly basis over the past 12 months, QGRD, CELS, and GGINC were in the top spot for three months each. CELS also had the highest number of monthly declines over the 12-month period, was in the bottom spot seven times, and had the distinction of having both the best and worst monthly performance (up 15.59% in December and down 21.30% in October). From a comparative perspective, infrastructure and income indexes placed in the top monthly spot two-thirds of the time, while clean energy indexes placed in the bottom slot 11 out of 12 months.
 Source: Nasdaq, Inc.
WINNERS AND LOSERS (INDEX CONSTITUENTS RANKED BY PRICE RETURN)
Below is a list of the top 10 best and worst constituent performers across all six Nasdaq Clean Edge Nasdaq indexes during Q1 2024.
Best and Worst Constituents (Q1 2024)
Winners | Losers | ||
|---|---|---|---|
HD Hyundai Electric Co., Ltd. | 108.79% | Meyer Burger Technology AG | -68.22% |
Fortune Electric Co., Ltd. | 100.30% | Sunnova Energy International, Inc. | -59.80% |
NVIDIA Corporation | 82.46% | ams-OSRAM AG | -53.70% |
Iljin Electric Co., Ltd. | 81.17% | Maxeon Solar Technologies, Ltd. | -53.56% |
Hammond Power Solutions Inc. Class A | 72.93% | Rivian Automotive, Inc. Class A | -53.32% |
Hyosung Heavy Industries Corp. | 67.81% | Montauk Renewables, Inc. | -53.31% |
Chung-Hsin Electric & Machinery Manufacturing Corp. | 47.76% | China High Speed Transmission Equipment Group Co., Ltd. | -52.87% |
GS Yuasa Corporation | 47.63% | Solaria Energia y Medio Ambiente, S.A. | -46.91% |
Wasion Holdings Ltd. | 44.06% | Stem, Inc. | -43.56% |
Flat Glass Group Co., Ltd. Class H | 43.98% | Navitas Semiconductor Corporation | -40.89% |
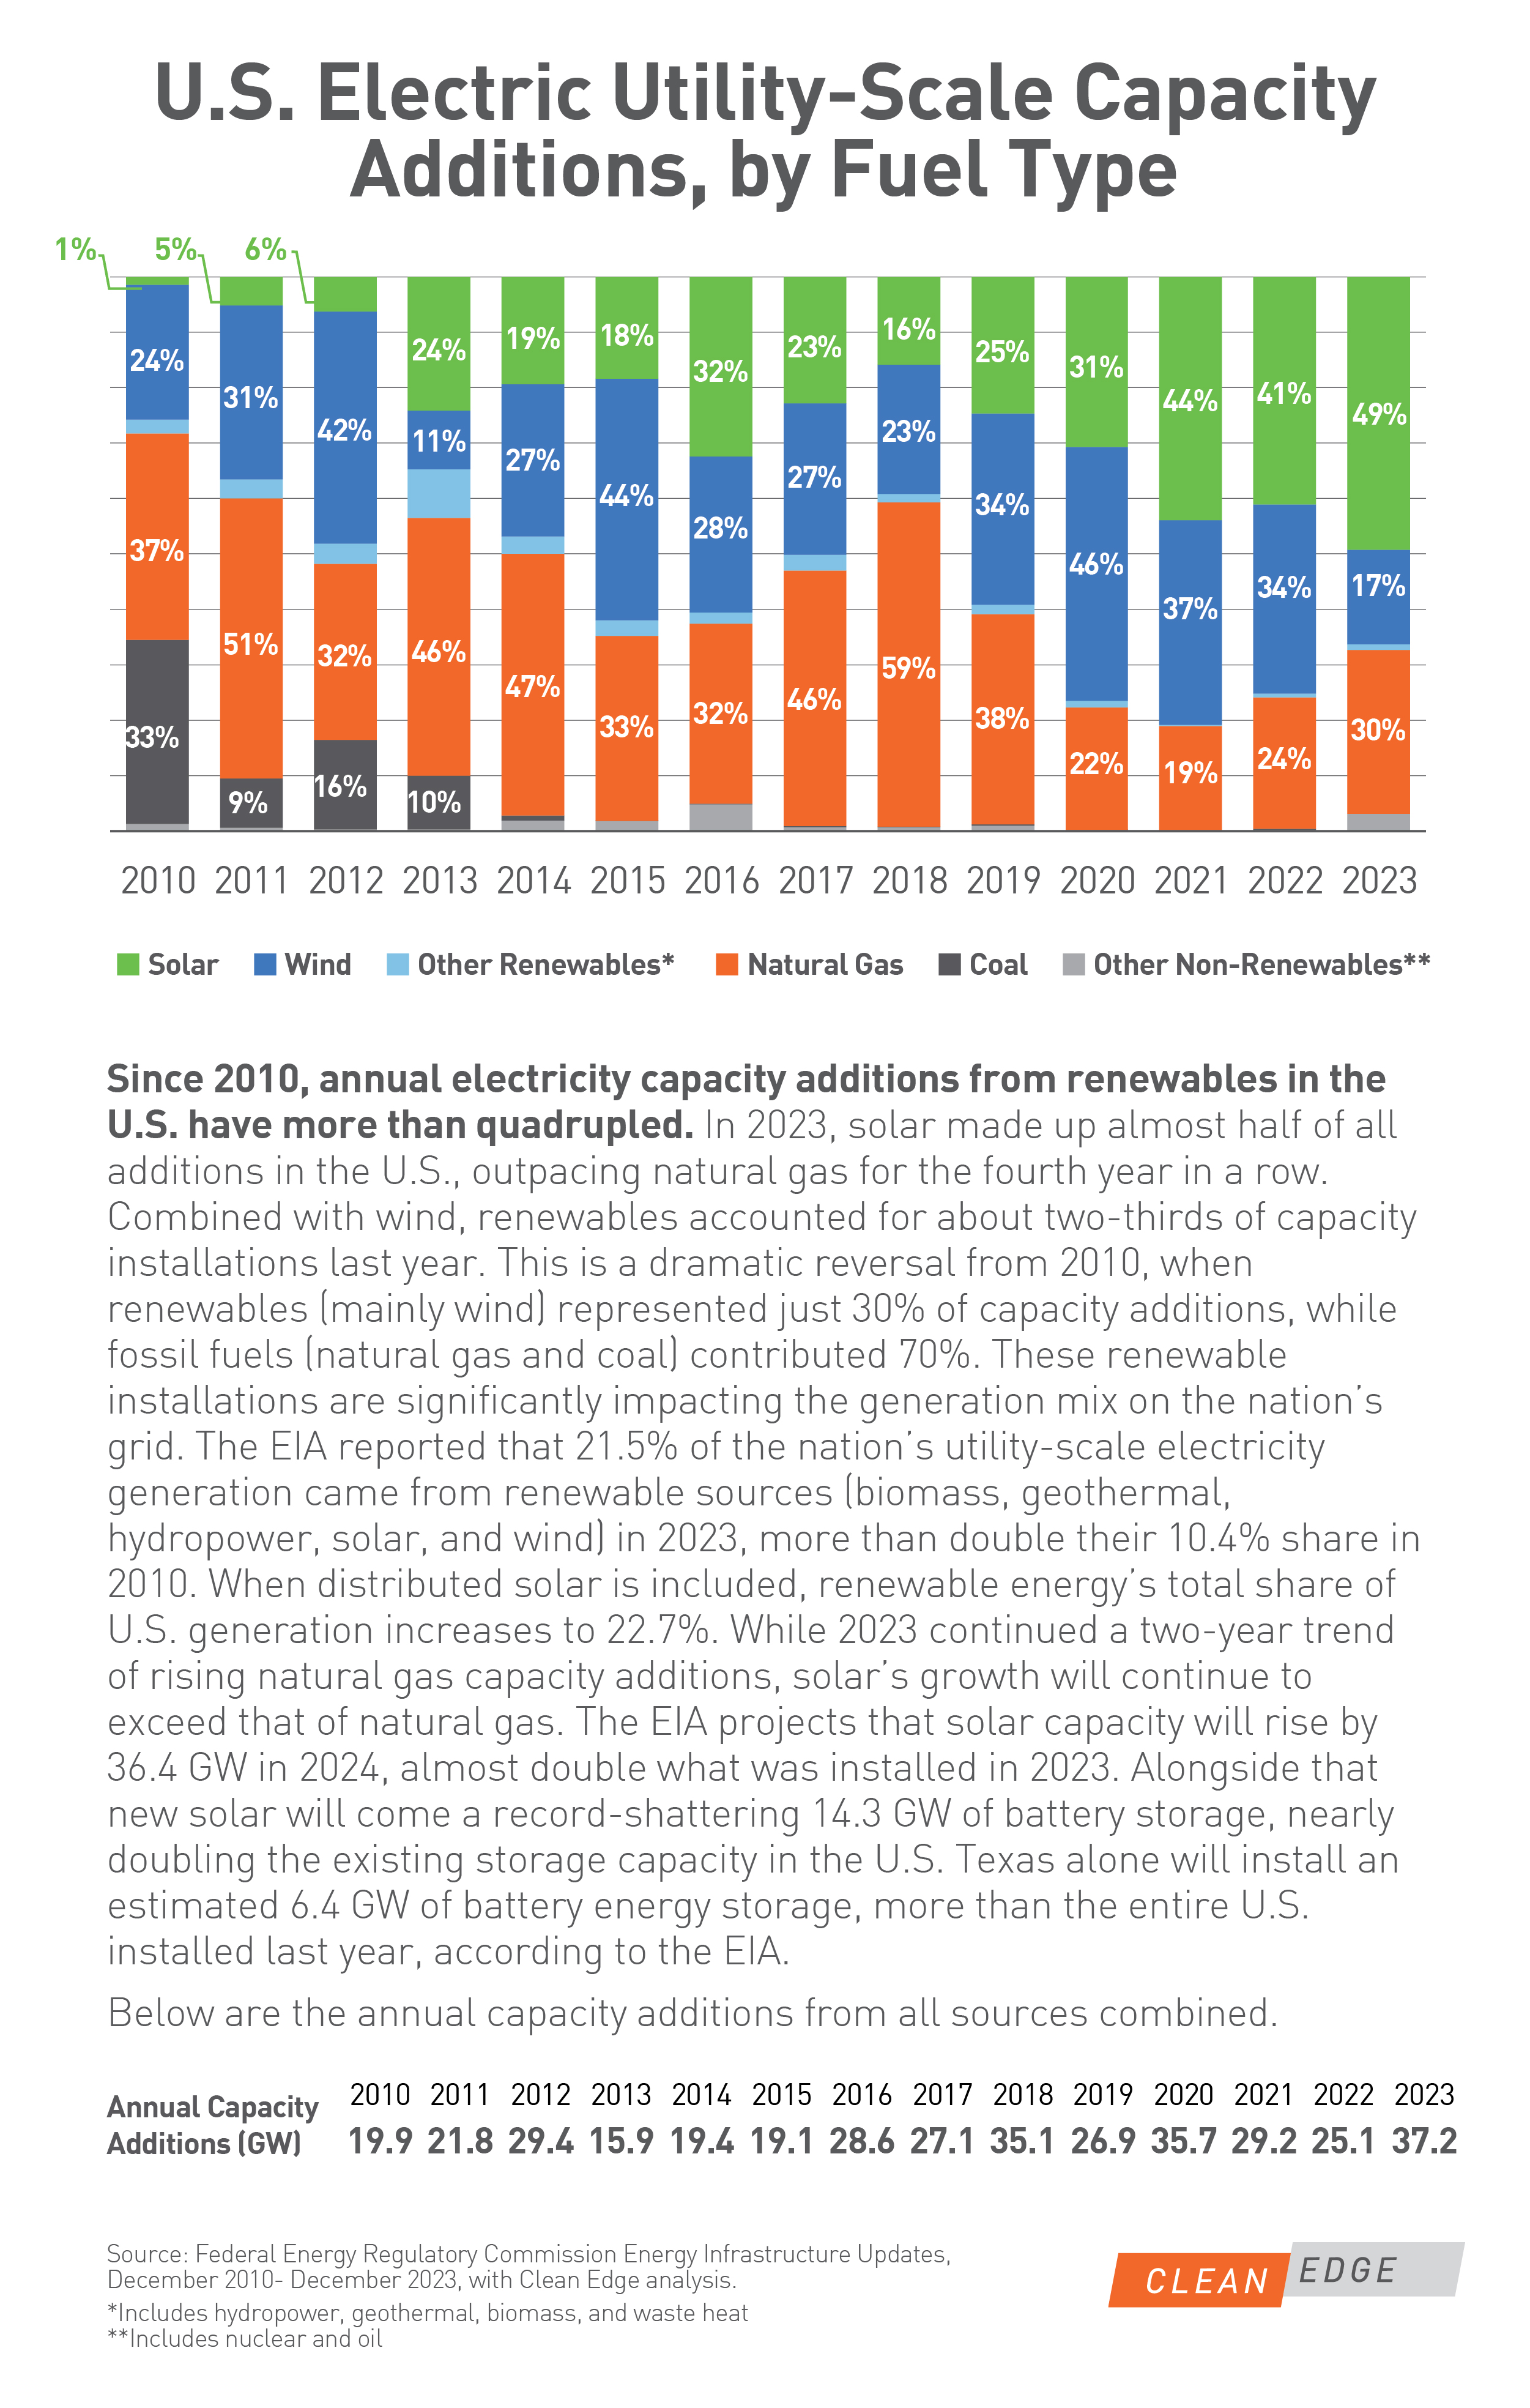
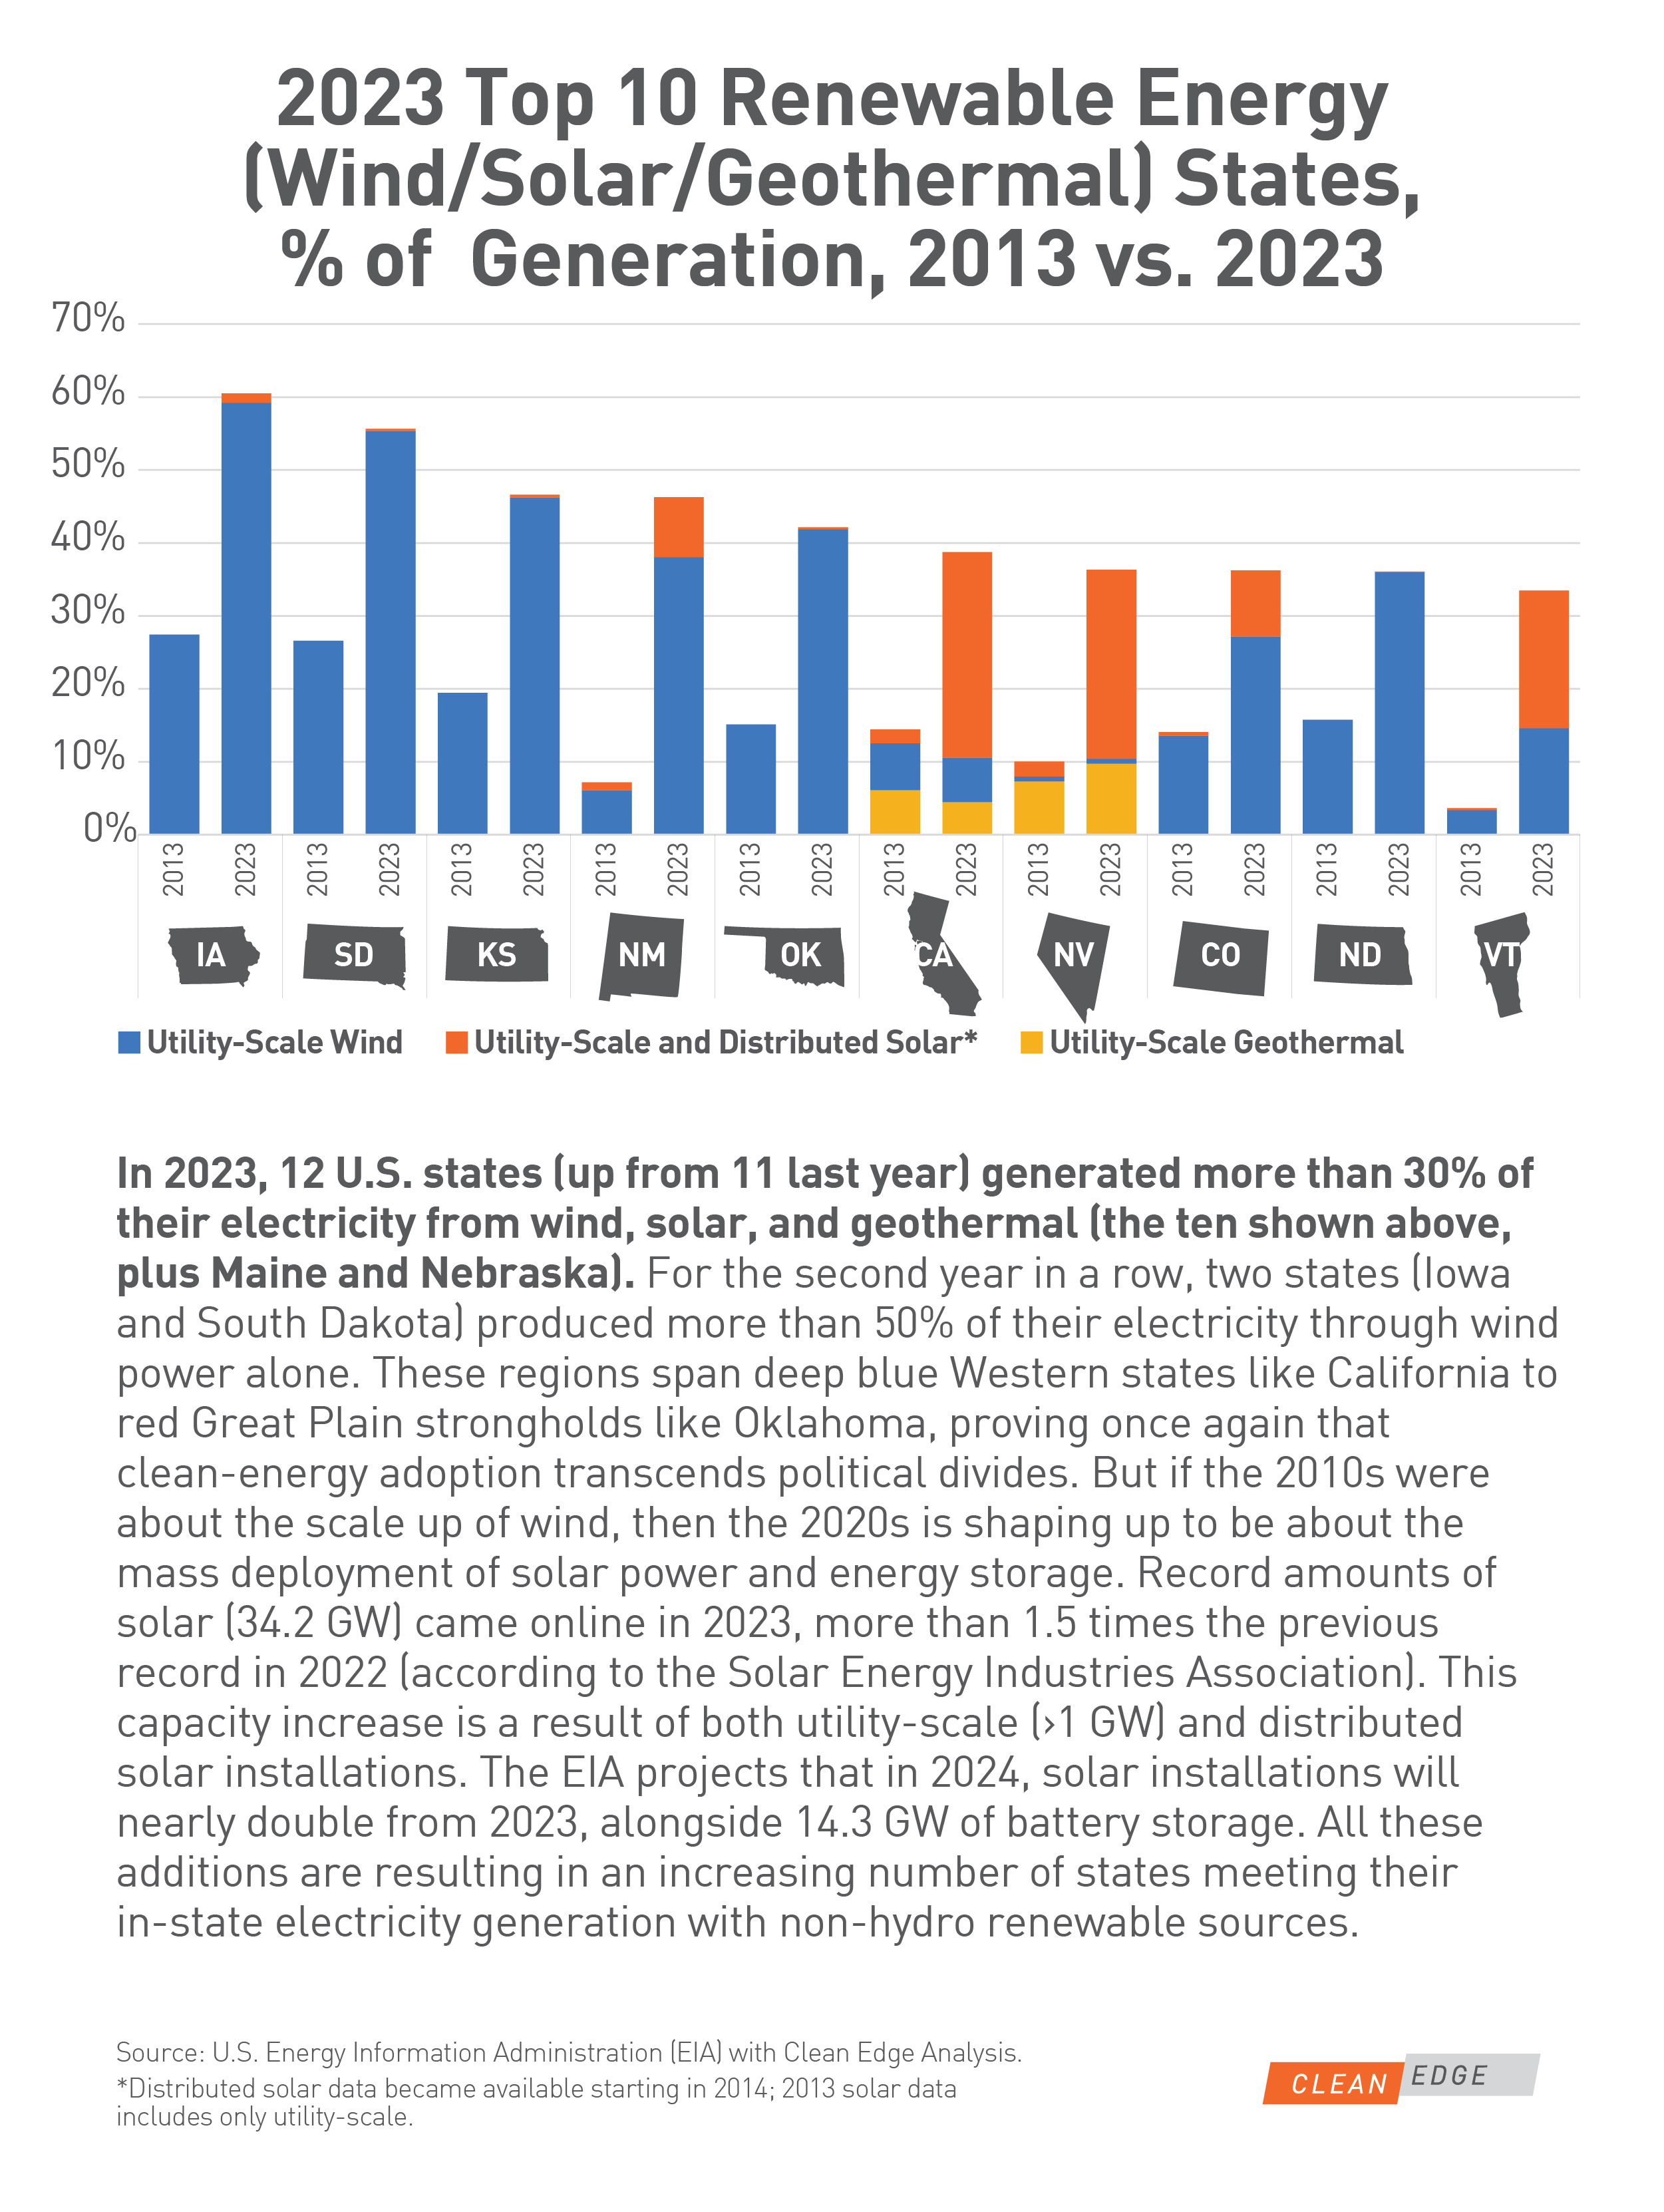
CLEAN EDGE INSIGHTS: OUR LATEST DATA DIVE CHARTS
Disclaimer:
Nasdaq® is a registered trademark of Nasdaq, Inc. and Clean Edge® is a registered trademark of Clean Edge, Inc. The information contained above is provided for informational and educational purposes only, and nothing contained herein should be construed as investment advice, either on behalf of a particular security or an overall investment strategy. Neither Nasdaq, Inc. nor Clean Edge, Inc. nor any of its affiliates makes any recommendation to buy or sell any security or any representation about the financial condition of any company. Statements regarding Nasdaq-listed or other publicly listed companies or Nasdaq Clean Edge proprietary indexes are not guarantees of future performance. Actual results may differ materially from those expressed or implied. Past performance is not indicative of future results. Investors should undertake their own due diligence and carefully evaluate companies before investing. ADVICE FROM A SECURITIES PROFESSIONAL IS STRONGLY ADVISED.